4
$\begingroup$

I got this code from a previous thread and then modified it a bit.

s[t_] := -2.7 t^2 + 30 t + 6.5;
Dynamic@Plot[{-2.7 t^2 + 30 t + 6.5, 2 + 3 t}, {t, 0, 15}, 
  Mesh -> {{Clock[{0, 15}, 10, 10]}}, 
  MeshStyle -> {Directive[PointSize[Large], Red], 
    Directive[PointSize[Large], Blue]}, GridLines -> Automatic]

enter image description here

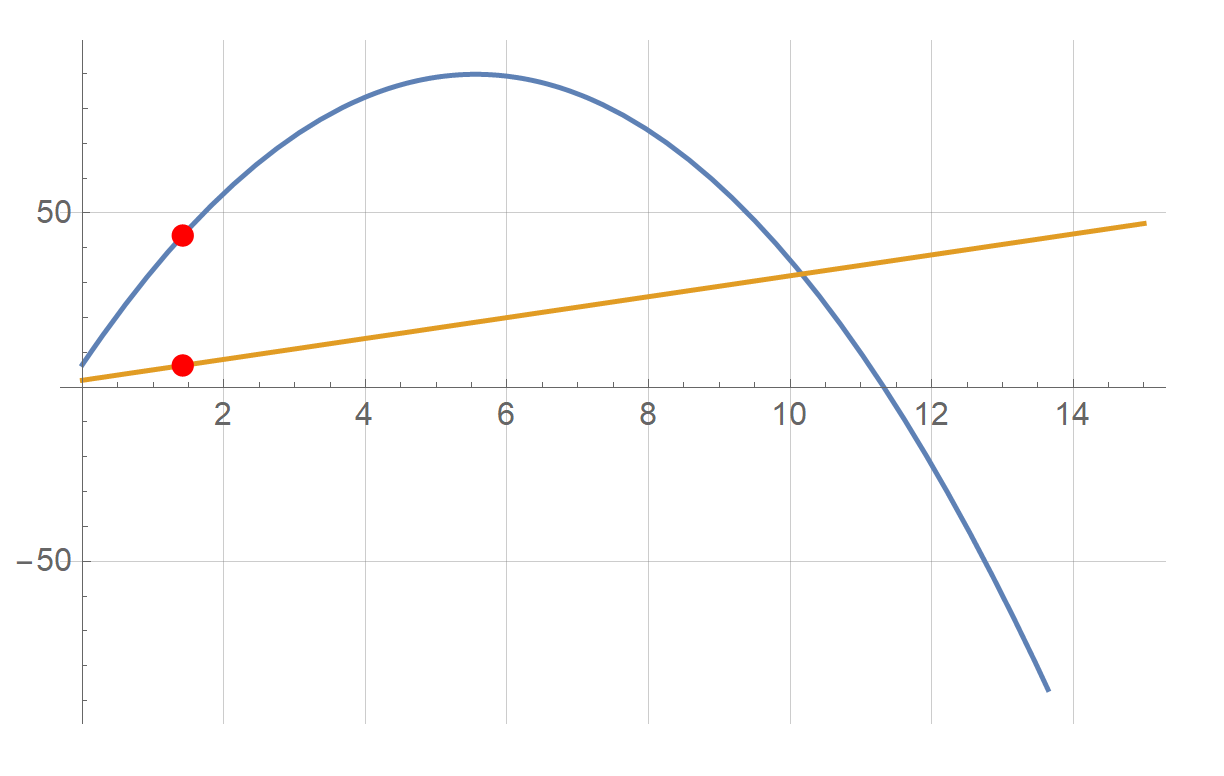
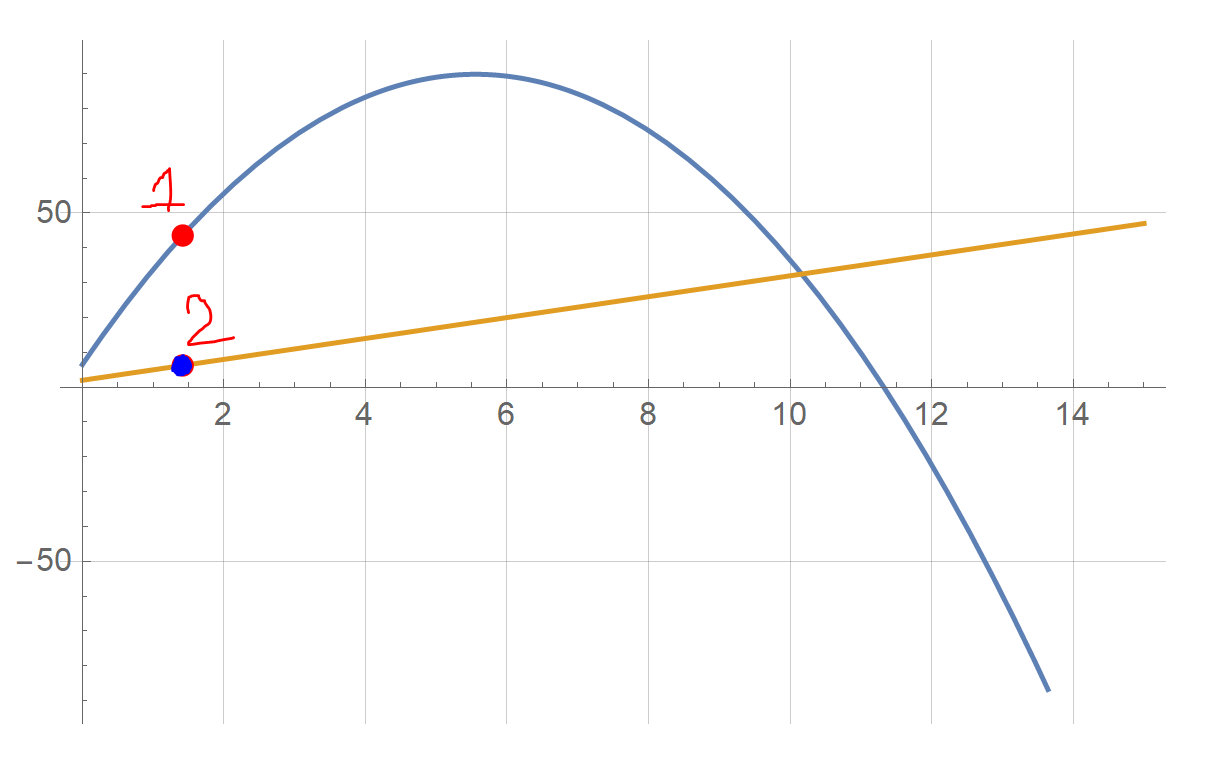
How can I change one dot to Blue and one Red? I tried Directive from MeshStyle but it doesn't work. Would it be possible to add number 1 and 2 that move along the line with these points?

enter image description here

$\endgroup$
4
  • $\begingroup$ Can you try changing the MeshStyle by adding extra brackets? I mean MeshStyle -> {{Directive[PointSize[Large], Red]}, {Directive[ PointSize[Large], Blue]}}? Does this work? $\endgroup$
    – user49048
    Commented Feb 9, 2022 at 1:15
  • $\begingroup$ @DiSp0sablE_H3r0 nope, both are red. $\endgroup$
    – hana
    Commented Feb 9, 2022 at 1:17
  • 1
    $\begingroup$ Hi, I extended you question and added an answer here. It goes beyond what you asked, so I wasn't sure you would find useful. But you might, and I hope you find it interesting in any event. $\endgroup$
    – Michael E2
    Commented Feb 9, 2022 at 22:08
  • $\begingroup$ @MichaelE2 thanks, that looks nice. $\endgroup$
    – hana
    Commented Feb 9, 2022 at 22:18

3 Answers 3

3
$\begingroup$

One approach would be to use Overlay:

Dynamic[
  Overlay[
   {Plot[{-2.7 t^2+30 t+6.5},{t,0,15},Mesh->{{Clock[{0,15},10,10]}},
      MeshStyle->{Directive[PointSize[Large],Red]},
      GridLines->Automatic,PlotRange->{-150,100}],
    Plot[{2+3 t},{t,0,15},Mesh->{{Clock[{0,15},10,10]}},
      MeshStyle->{Directive[PointSize[Large],Green]},
      GridLines->Automatic,PlotRange->{-150,100}]}]]
$\endgroup$
3
  • $\begingroup$ this works fine but in my case the number of functions may be large so the code is a bit long. $\endgroup$
    – hana
    Commented Feb 9, 2022 at 1:30
  • 1
    $\begingroup$ Then maybe what you want to do is calculate all of the points, wrap them in Point with the appropriate decorations (like color, which you'll have to also calculate, maybe by using ColorData), and then use Epilog to overlay them. (Note, I haven't actually tried it yet.) $\endgroup$
    – lericr
    Commented Feb 9, 2022 at 1:39
  • 1
    $\begingroup$ And it might be easier to use Animate than Dynamic. Again, I'd have to play around to compare the two approaches--it's just a thought. $\endgroup$
    – lericr
    Commented Feb 9, 2022 at 1:41
3
$\begingroup$

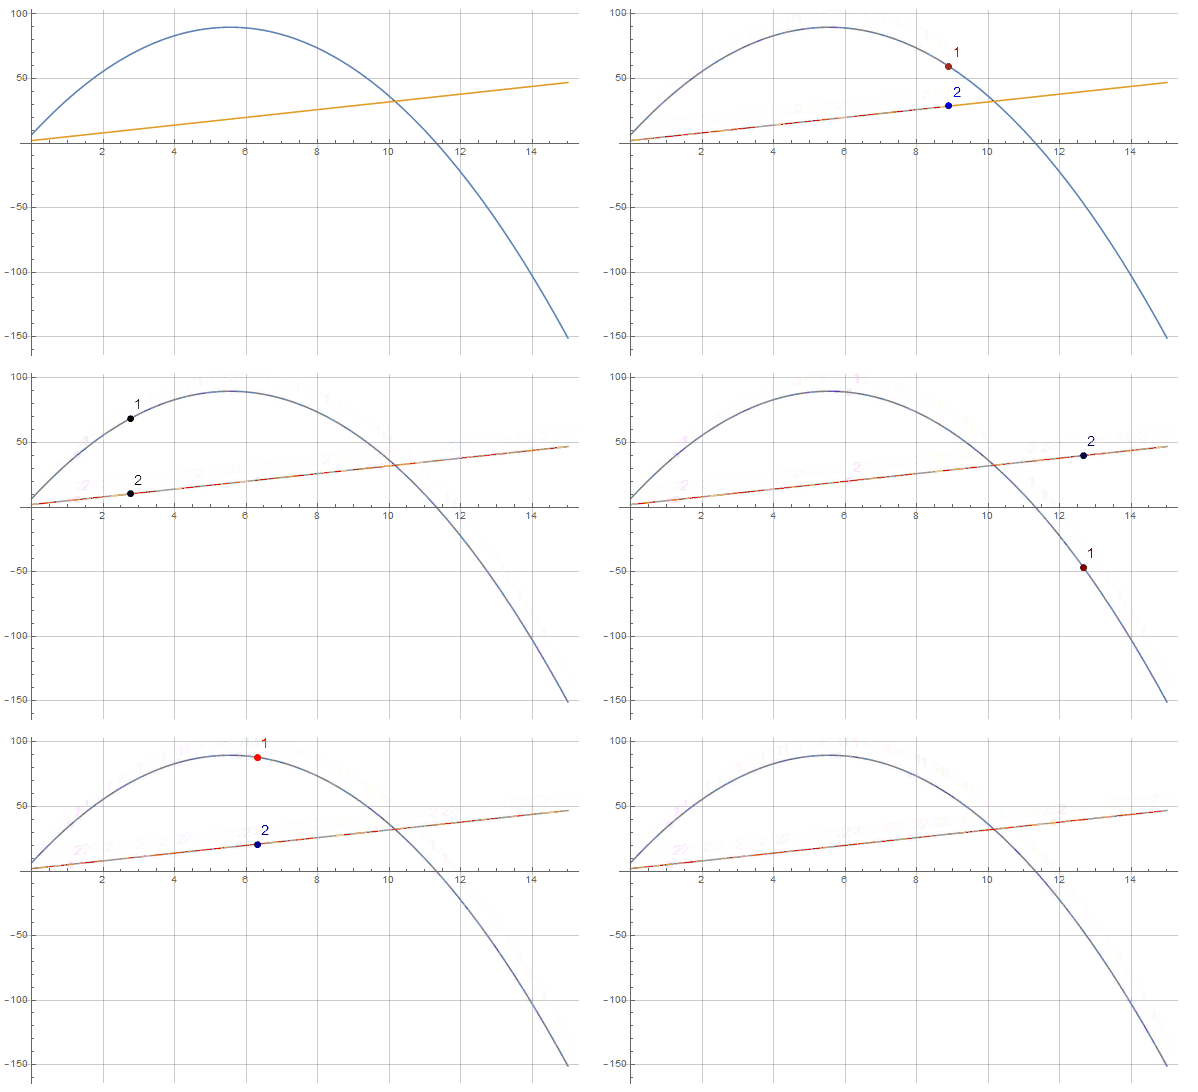
1. Construct two plots with desired mesh styles and combine with Show:

Dynamic @ Show[MapThread[ReplaceAll[p_Point :>
       {p, Text[Style[#4, 14], Offset[{5, 5}, p[[1]]], {-1, -1}]}] @ 
   Normal @ Plot[#, {t, 0, 15}, Mesh -> {{Clock[{0, 15}, 10, 3]}}, 
      MeshStyle -> Directive[PointSize@Large, #2], PlotStyle -> #3, 
      GridLines -> Automatic, ImageSize -> Large] &, 
   {{-2.7 t^2 + 30 t + 6.5, 2 + 3 t}, colors, ColorData[97] /@ {1, 2}, {1, 2}}]]

enter image description here

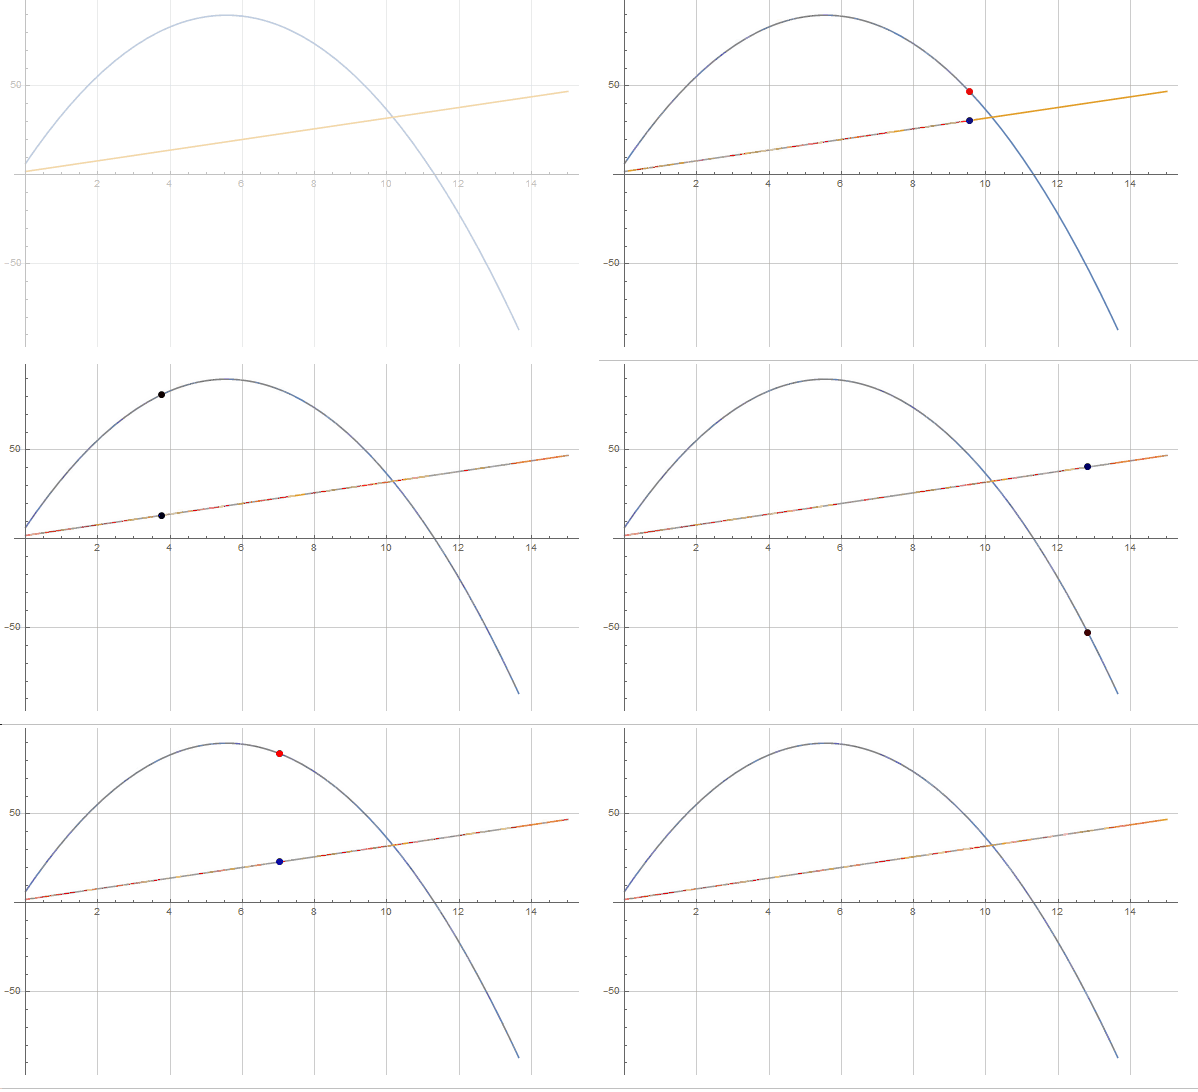
2. You can post-process Plot output to inject colors before Points:

colors = {Red, Blue};

Dynamic[ReplaceAll[Point[x_] :> Riffle[Point /@ x, colors, {1, -2, 2}]] @
  Plot[{-2.7 t^2 + 30 t + 6.5, 2 + 3 t}, {t, 0, 15}, 
   Mesh -> {{Clock[{0, 15}, 10, 3]}}, MeshStyle -> PointSize[Large], 
   GridLines -> Automatic, ImageSize -> Large] ]

enter image description here

$Version
"11.3.0 for Microsoft Windows (64-bit) (March 7, 2018)"
$\endgroup$
12
  • $\begingroup$ somehow it does not work in my PC (mathematica 12.2.0.0) $\endgroup$
    – hana
    Commented Feb 9, 2022 at 1:28
  • $\begingroup$ @hana, see if the first method works in your version/os. $\endgroup$
    – kglr
    Commented Feb 9, 2022 at 1:44
  • $\begingroup$ yea, first one works fine. $\endgroup$
    – hana
    Commented Feb 9, 2022 at 1:45
  • 1
    $\begingroup$ @hana, please see the update. $\endgroup$
    – kglr
    Commented Feb 9, 2022 at 2:04
  • 1
    $\begingroup$ I just found that I can add more CLOCK for each. $\endgroup$
    – hana
    Commented Feb 9, 2022 at 2:36
3
$\begingroup$
Clear[colors, f, g];
colors = {Red, Blue};
f[t_] = -2.7 t^2 + 30 t + 6.5;
g[t_] = 2 + 3 t;
Dynamic@(Block[{e = 0, τ = Clock[{0, 15}, 10, 10]}, 
   Plot[{f[t], g[t]}, {t, 0, 15}, Mesh -> {{τ}}, 
     MeshStyle -> PointSize[Large], GridLines -> Automatic] /. 
    Point[a_] :> {colors[[++e]], Point[a]}])
  • Epilog
Clear[f, g];
f[t_] = -2.7 t^2 + 30 t + 6.5;
g[t_] = 2 + 3 t;
Dynamic@Block[{τ = Clock[{0, 15}, 10, 10]}, 
  Plot[{f[t], g[t]}, {t, 0, 15}, GridLines -> Automatic, 
   Epilog -> {{Red, PointSize -> Large, 
      Point[{τ, f[τ]}]}, {Pink, 
      Text[1, {τ, f[τ]}, {0, -2}]}, {Blue, 
      PointSize -> Large, Point[{τ, g[τ]}]}, {Cyan, 
      Text[2, {τ, g[τ]}, {0, -2}]}}]]
$\endgroup$

Your Answer

By clicking “Post Your Answer”, you agree to our terms of service and acknowledge you have read our privacy policy.

Not the answer you're looking for? Browse other questions tagged or ask your own question.