5
$\begingroup$

I am using v8 and have the following code:

BarChart[#, ChartStyle -> "Pastel", 
ChartLabels -> (Rotate[#, Pi/3] & /@ #2)] & @@ Transpose[totals4]

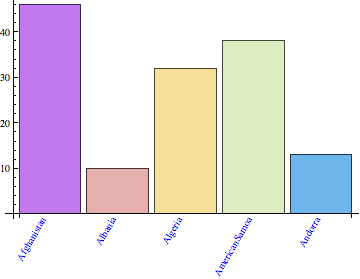
It creates a bar chart and places the labels at a angel that slopes from the bottom, up to the right (slants to the right). The labels are not centered with the bars. In other words if there are 10 vertical bars, the corresponding labels are not centered, rather they are shifted to the right.

How can I center the labels?

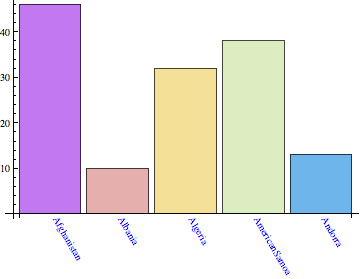
How can I have the labels slant to the left?

Example of how it looks currently:
countries

Thank you for any help.

$\endgroup$
2
  • $\begingroup$ They look pretty centered under the bars to me. To rotate them the opposite direction (to the left), use ChartLabels -> (Rotate[#, -Pi/3] & /@ #2). $\endgroup$
    – kale
    Commented Jun 3, 2013 at 2:30
  • 1
    $\begingroup$ I think the most reasonable interpretation is that the uppermost part of the label should start/end at the center of its bar. $\endgroup$
    – C. E.
    Commented Jun 3, 2013 at 3:39

1 Answer 1

6
$\begingroup$

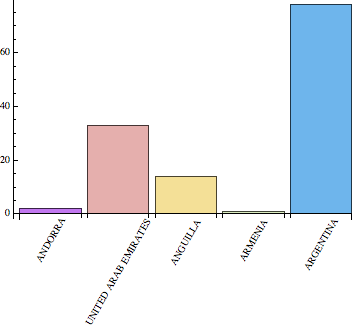
With the interpretation by Anon, here is a solution that places the labels below the bars with their top right corners aligned to the center:

totals4 = 
  Transpose@{RandomInteger[{0, 60}, 5], CountryData[][[1 ;; 5]]};

BarChart[#, ChartStyle -> "Pastel", 
   ChartLabels -> (Placed[
      Rotate[Style[#, Blue], Pi/3] & /@ #2, {{.5, 0}, {1, 1}}])] & @@ 
 Transpose[totals4]

placed

In the Placed command, the relative positions are numeric, because symbols like Center don't seem to work in version 8.

The second position argument {1, 1} is the top right corner of the rotated text label. To slant the labels in the opposite direction, I assume you want the following:

BarChart[#, ChartStyle -> "Pastel", 
   ChartLabels -> (Placed[
      Rotate[Style[#, Blue], -Pi/3] & /@ #2, {{.5, 0}, {0, 1}}])] & @@
  Transpose[totals4]

The reading direction is still mostly left to right, so that now we want to align the left top of the label text with the center of the bar. That's why I changed the second position argument of Placed to {0, 1}.

placed 2

$\endgroup$
4
  • $\begingroup$ Is there a way to do something this simply for FrameTicks labels? I have contrived a solution but it's not pretty. $\endgroup$
    – Mr.Wizard
    Commented Jun 3, 2013 at 5:36
  • $\begingroup$ @Mr.Wizard Do you mean FrameTicks in general, or specifically in Charts? I've never tried Placed outside charts or graphs, I think... $\endgroup$
    – Jens
    Commented Jun 3, 2013 at 5:54
  • $\begingroup$ @Mr.Wizard Probably the answer is no; the Placed objects are realized as regular Inset boxes, and the tick labels aren't. Inset has the two pos and opos arguments, but I don't see anything along those lines for tick labels, unless you either wrap them in Graphics or roll your own from scratch. Well, and of course there is always a chance that Wizardry finds an alternate route... $\endgroup$
    – Jens
    Commented Jun 3, 2013 at 6:13
  • $\begingroup$ Thank you this works, however is there a way that the labels can have the same color as the bars? Again thank you. $\endgroup$
    – sente
    Commented Jun 3, 2013 at 9:42

Not the answer you're looking for? Browse other questions tagged or ask your own question.