2
$\begingroup$

With the following code, I can calculate percentage changes in selected indicators over time. The code is not efficient nor practical to integrate it into Manipulate function I already have.

pch[x1_, x2_] := Quantity[((x2 - x1)/x1)*100, "Percent"];
jdata[GroupBy["country"], GroupBy["time"], All, {"EVI"}]["Bhutan"] // Normal
jdata[GroupBy["country"], GroupBy["time"], All, {"Exposure index"}]["Bhutan"] // Normal

extracts the data for "EVI" and "Exposure index" indicators for Bhutan.

<|2012.` -> {<|"EVI" -> 44.19255725212609`|>}, 
  2015.` -> {<|"EVI" -> 40.19403209871271`|>}, 
  2018.` -> {<|"EVI" -> 36.26105903025079`|>}, 
  2021.` -> {<|"EVI" -> 25.73725117803039`|>}|>

<|2012.` -> {<|"Exposure index" -> 42.47413422316401`|>}, 
  2015.` -> {<|"Exposure index" -> 38.87846003288048`|>}, 
  2018.` -> {<|"Exposure index" -> 39.04960632190836`|>}, 
  2021.` -> {<|"Exposure index" -> 
 Missing["KeyAbsent", "Exposure index"]|>}|>

I then calculate the percentage change using:

(* percentage change in "EVI" in Bhutan *)
x1 = jdata[GroupBy["country"], GroupBy["time"], All, {"EVI"}][
  "Bhutan", First, 1, "EVI"]
x2 = jdata[GroupBy["country"], GroupBy["time"], All, {"EVI"}][
  "Bhutan", Last, 1, "EVI"]
pch[x1, x2]

which generates:

Quantity[-41.7611, "Percent"]

I repeat the same operation for "Exposure index" indicator:

 (* percentage change in "Exposure index" in Bhutan *)
 x1 = jdata[GroupBy["country"], GroupBy["time"], 
   All, {"Exposure index"}]["Bhutan", First, 1, "Exposure index"]
 x2 = jdata[GroupBy["country"], GroupBy["time"], All, {"Exposure  index"}]["Bhutan", Last, 1, "Exposure index"]

 pch[x1, x2]

This does not work because the last element of the indicator is missing:

 2.35437 (-42.4741 + Missing["KeyAbsent", "Exposure index"])

My questions/requests:

  1. I like to make the percentage change calculations automatically not in the way I illustrated above because I have many indicators to calculate percentage change over time. If possible, calculate the percentage changes for all indicators, not one by one, as I did above.

  2. On the way, I encounter a Missing[Key] problem because sometimes the first and sometimes the last year's data are missing. In that case, I want to calculate the percentage change over the existing data.

  3. My code is not efficient and I would like to have a better code to calculate all the percentage changes in all the indicators in the dataset at once.

Any help?

$\endgroup$

2 Answers 2

1
$\begingroup$

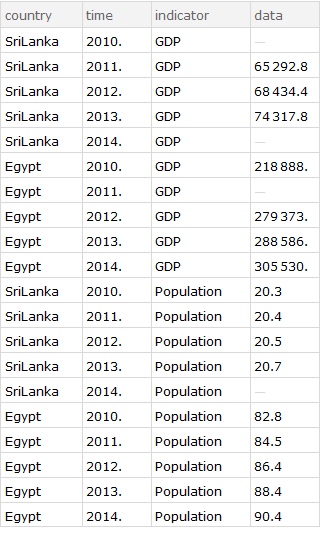
An example dataset similar to the one in OP:

data = 
 {<|"country" -> "SriLanka", "time" -> 2010., "indicator" -> "GDP", "data" -> Missing[]|>, 
  <|"country" -> "SriLanka", "time" -> 2011., "indicator" -> "GDP", "data" -> 65292.8|>, 
  <|"country" -> "SriLanka", "time" -> 2012., "indicator" -> "GDP", "data" -> 68434.4|>,
  <|"country" -> "SriLanka", "time" -> 2013., "indicator" -> "GDP", "data" -> 74317.8|>, 
  <|"country" -> "SriLanka", "time" -> 2014., "indicator" -> "GDP", "data" -> Missing[]|>, 
  <|"country" -> "Egypt", "time" -> 2010., "indicator" -> "GDP", "data" -> 218888.3|>, 
  <|"country" -> "Egypt", "time" -> 2011., "indicator" -> "GDP", "data" -> Missing[]|>,
  <|"country" -> "Egypt", "time" -> 2012., "indicator" -> "GDP", "data" -> 279372.8|>, 
  <|"country" -> "Egypt", "time" -> 2013., "indicator" -> "GDP", "data" -> 288586.2|>, 
  <|"country" -> "Egypt", "time" -> 2014., "indicator" -> "GDP", "data" -> 305529.7|>, 
  <|"country" -> "SriLanka", "time" -> 2010., "indicator" -> "Population", "data" -> 20.3|>, 
  <|"country" -> "SriLanka", "time" -> 2011., "indicator" -> "Population", "data" -> 20.4|>,
  <|"country" -> "SriLanka", "time" -> 2012., "indicator" -> "Population", "data" -> 20.5|>,
  <|"country" -> "SriLanka", "time" -> 2013., "indicator" -> "Population", "data" -> 20.7|>,
  <|"country" -> "SriLanka", "time" -> 2014., "indicator" -> "Population", "data" -> Missing[]|>,
  <|"country" -> "Egypt", "time" -> 2010., "indicator" -> "Population", "data" -> 82.8|>,
  <|"country" -> "Egypt", "time" -> 2011., "indicator" -> "Population", "data" -> 84.5|>, 
  <|"country" -> "Egypt", "time" -> 2012., "indicator" -> "Population", "data" -> 86.4|>,
  <|"country" -> "Egypt", "time" -> 2013., "indicator" -> "Population", "data" -> 88.4|>,
  <|"country" -> "Egypt", "time" -> 2014., "indicator" -> "Population", "data" -> 90.4|>};

ds = Dataset @ data

enter image description here

percentChange = 100 Differences @ # / # &;

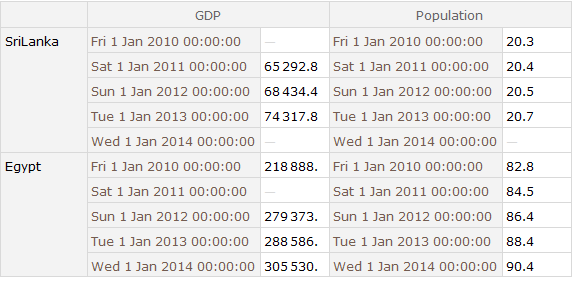
A simple query to get a dataset of time series:

timeseries = ds[GroupBy["country"], 
  Merge[TimeSeries], 
  <|#indicator -> {DateObject @ Round[{#time}], #data}|> &, 
  MissingBehavior -> None]

enter image description here

If needed we can get a dataset of date paths using the property "DatePath":

timeseries[Map[Map[AssociationThread @@ Transpose[#["DatePath"]] &]]]

enter image description here

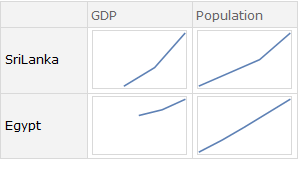
Or a dataset of DateListPlots:

timeseries[Map[Map[DateListPlot]]]

enter image description here

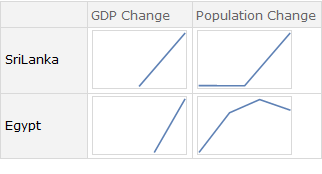
Similarly, we can construct a dataset of percent change time series:

pctimeseries = timeseries[Map[KeyMap[# <> " Change" &]] /* 
    Map[Map[#["DatePath"] & @* percentChange]], 
   MissingBehavior -> None]

enter image description here

To process cells involving Missing[] we use

processMissing = <|#["Year"] -> 
     ReplaceAll[#2, _?(Not@*FreeQ[_Missing]) :> Missing[]]|> &;

pctimeseries = timeseries[Map[KeyMap[# <> " Change" &]] /* 
    Map[Map[Join @@ processMissing @@@ #["DatePath"] & @* percentChange]], 
  MissingBehavior -> None]

enter image description here

pctimeseries["SriLanka", "GDP Change", Key@2012]
4.59067
Normal @ pctimeseries["Egypt", "GDP Change", Key /@ {2013, 2014}]
<|2013 -> 3.1926, 2014 -> 5.54561|>
Normal @ pctimeseries["Egypt", {"GDP", "Population"}, Key@2013]
<|"GDP" -> 3.19256, "Population" -> 2.262443|>
pctimeseries[Map[Map[DateListPlot]]]

enter image description here

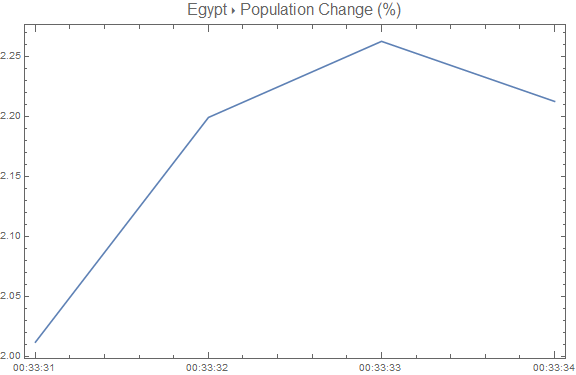
pctimeseries[DateListPlot[#Egypt, 
    PlotLabel -> Style["Egypt ▸ Population Change (%)", 16], 
    ImageSize -> Large] &,
   "Population Change"]

enter image description here

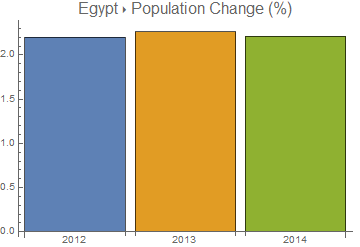
pctimeseries[BarChart[#"Egypt", 
    PlotLabel -> Style["Egypt ▸ Population Change (%)", 16], 
    ChartStyle -> 97, ChartLabels -> {2012, 2013, 2014}, 
    "FixedBarSpacing" -> True] &, 
 "Population Change", 
  Key /@ {2012, 2013, 2014}]

enter image description here

etc.

Note: We can also use a query on ds to get the dataset pctimeseries:

pctimeseries2 = ds[GroupBy["country"] /* Map[KeyMap[# <> " Change" &]], 
  Merge[TimeSeries /* percentChange /* 
    (processMissing @@@ #["DatePath"] &) /* Apply[Join]],
  <|#indicator -> {DateObject @ Round[{#time}], #data}|> &, 
 MissingBehavior -> None] ;

pctimeseries2 == pctimeseries
True
$\endgroup$
7
  • $\begingroup$ Thanks for a thorough code. I tried to replicate your code with my data set and was successfully getting the exact list of outputs like yours given above. However, at the stage where pctimeseries = timeseries[...] I started to get an error message: Path is expected to be non-empty. I tried various things but still, have the same error. Why do you think I get this error? $\endgroup$ Commented Nov 14, 2021 at 15:37
  • $\begingroup$ The error pups up after timeseries[Map[Map[DateListPlot]]]. $\endgroup$ Commented Nov 14, 2021 at 15:40
  • $\begingroup$ a wild guess: probably some country/indicator combinations are empty in your data. $\endgroup$
    – kglr
    Commented Nov 14, 2021 at 16:18
  • $\begingroup$ Your guess is true. Is there any easy way to overcome this error? $\endgroup$ Commented Nov 14, 2021 at 16:38
  • 1
    $\begingroup$ does timeseries[Map[Map[DateListPlot]], FailureAction ->"Drop", MissingBehavior -> None] fix the issue? $\endgroup$
    – kglr
    Commented Nov 14, 2021 at 19:22
0
$\begingroup$

The following code (thanks to @Rohi Namjoshi) does what I intend to do but with few caveats:

Row[{
  jdata[GroupBy[Key["country"]], All, {"Exposure index", "EVI"}] // 
       Map[Quantity[100.*(Last@# - First@#)/First@#, "Percent"] &], Spacer[10],
  jdata[GroupBy[Key["country"]], Mean, {"Exposure index", "EVI"}]
    }]

as you can see from the output table, I am not able to cleanly present the calculations in columns. Indicator names should be column names and the associated calculations should be elements of columns. The first table corresponds to percentage changes and the latter one to mean for each country.

enter image description here

Also, I could not solve the Missing[Key] problem due to missing data for either the initial year or last year.

$\endgroup$

Your Answer

By clicking “Post Your Answer”, you agree to our terms of service and acknowledge you have read our privacy policy.

Not the answer you're looking for? Browse other questions tagged or ask your own question.