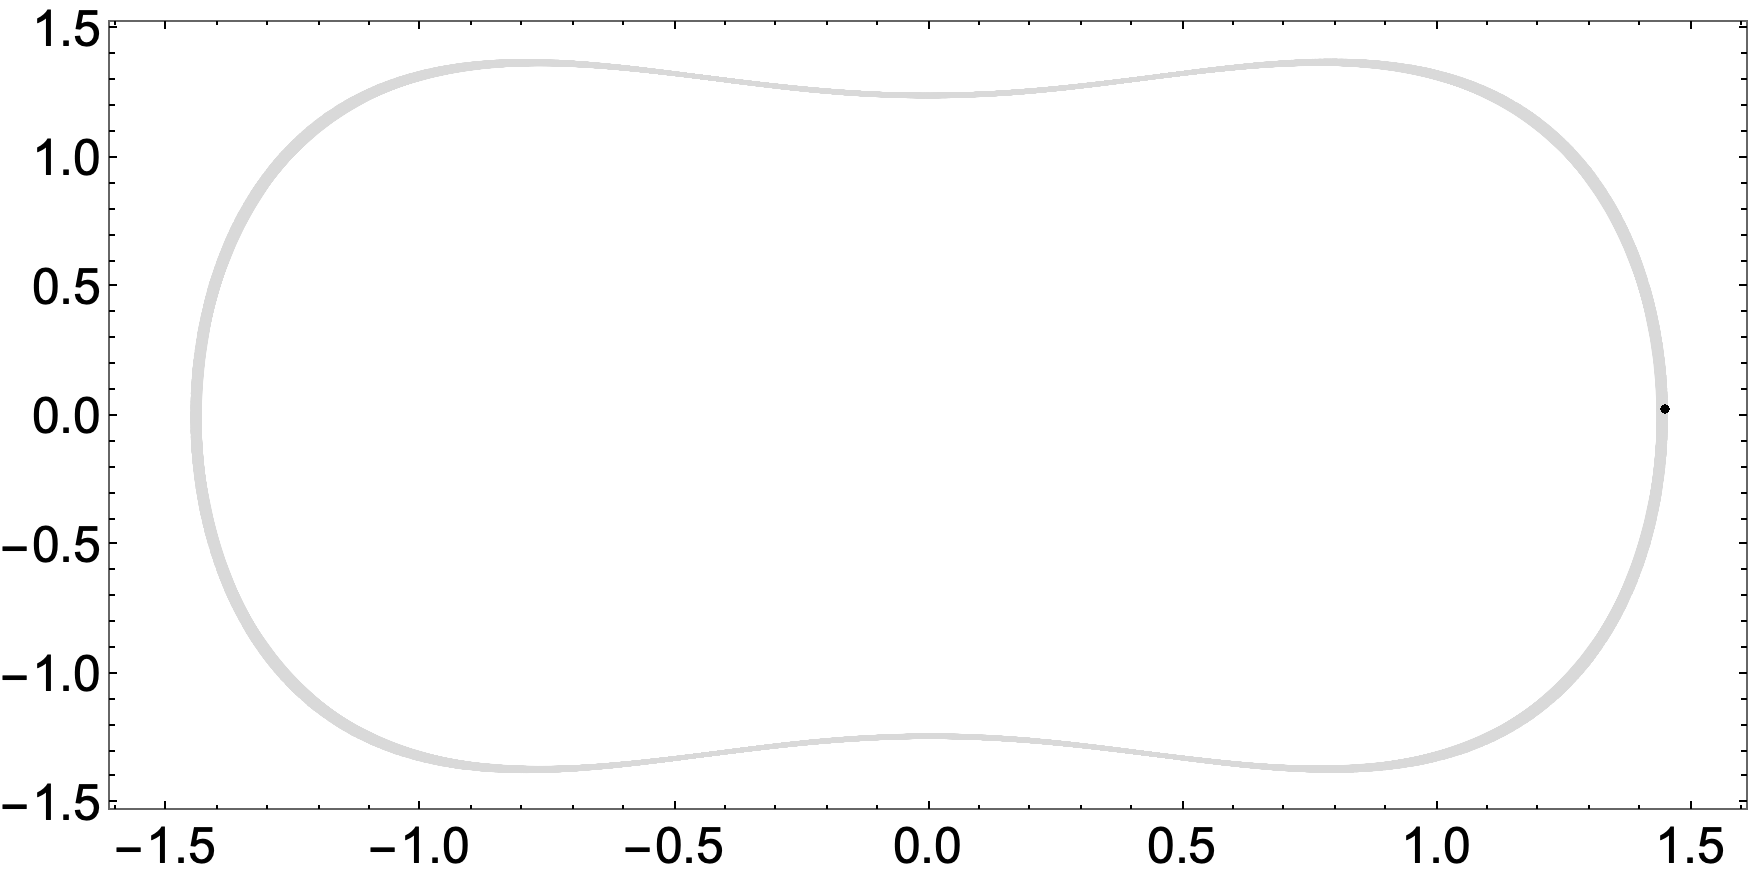
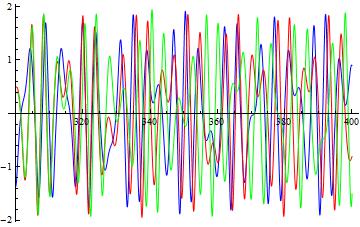
I am trying to plot phase diagram and poincare map. But I cannot get the poincare map as shown in the image below
Phase Space
sol = NDSolve[{v'[t] ==
     0.320 x[t] - 1.65 x[t]^3 - 0.005*v[t] + 0.855 Cos[1.2*t],
    x'[t] == v[t], x[0] == 0, v[0] == 0}, {x, v}, {t, 0, 1500}];
ParametricPlot[{x[t], v[t]} /. sol, {t, 200, 1000},
 AxesLabel -> {"x", "v"}, PlotRange -> Full, PlotStyle -> LightGray,
 Axes -> False, Frame -> True,
 FrameTicksStyle -> Directive[Black, 20], ImageSize -> {700, 350},
 AspectRatio -> Full]
Poincare Map
poincare[A_, gamma_, omega_, ndrop_, nplot_,
  psize_] := (T = 2*Pi/omega;
  g[{xold_, vold_}] := {x[T], v[T]} /.
    NDSolve[{v'[t] ==
        0.320 x[t] - 1.65 x[t]^3 - gamma*v[t] + A*Cos[omega*t],
       x'[t] == v[t], x[0] == xold, v[0] == vold}, {x, v}, {t, 0,
       T}][[1]];
  lp = ListPlot[Drop[NestList[g, {0, 0}, nplot + ndrop], ndrop],
    PlotStyle -> {PointSize[psize], Black}, Axes -> False,
    Frame -> True, FrameTicksStyle -> Directive[Black, 20],
    PlotRange -> All, AxesLabel -> {"x", "v"},
    ImageSize -> {700, 350}, AspectRatio -> Full])

poincare[0.855, 0.005, 1.2, 1000, 200, 0.01]
I want diagram as shown in below image(The phase diagram will be different for my code)


