19
$\begingroup$

I am using Inset to add an Epilog to a plot. The position of the images (in my case: framed numbers) can be specified as an option of Inset.

I would like the y-coordinate to be the same for all Inset elements (they are created via Table), relative to the plot size. Say, for example, it should be the y-coordinate of Scaled[*,0.9]. The x-coordinate should, for each element, be an absolute value, depending on its position in the table.

While I know how to specify relative and absolute coordinates, also as functions of the table position, I can't get Scaled to work for only one coordinate: specifying my Inset coordinates via something like

{*abs. value*, Scaled[.9]}

yields the following error message:

Coordinate {*abs. value*, Scaled[0.9]} should be a pair of numbers, or a Scaled or Offset form.

Any help on this?


Update: I also tried snippets like Scaled[*some value*,.9][[2]] to extract the y-coordinate, but to no avail.

$\endgroup$
2
  • $\begingroup$ You might want to use Rescale[] to transform absolute coordinates to relative coordinates that you can then use with Scaled[]. $\endgroup$ Commented May 22, 2013 at 9:13
  • $\begingroup$ @J.M. Yes, that might be a workaround, but I want to insert the Inset into an Epilog, the Epilog into a Plot, the Plot possibly into a Show, etc - so that I don't yet know the minimum and maximum values of y (required for Rescale). I could of course use a function for this [checking for min. and max. values when the plot is created], but it seems it wound end up in a rather cumbersome construct just to specify a value for y... $\endgroup$
    – Bernd
    Commented May 22, 2013 at 9:21

4 Answers 4

11
$\begingroup$

Great question, to which I would like to know the answer myself, other than manual scaling as mentioned by J. M.


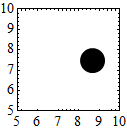
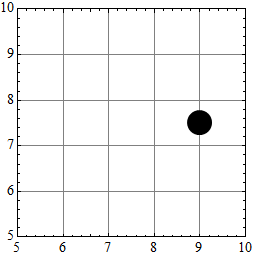
A partial solution is to use the second parameter of Scaled. Here I place a point at y scaled 1/2, and x plot coordinate 9. Note that y origin 5 must be known:

Graphics[{
  AbsolutePointSize[25],
  Point @ Scaled[{0, 1/2}, {9, 5}]
  },
 PlotRange -> {{5, 10}, {5, 10}},
 Frame -> True,
 GridLines -> Automatic
]

enter image description here


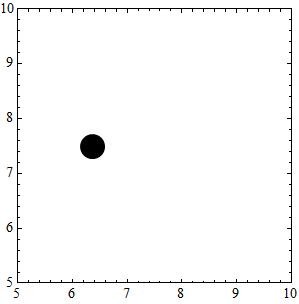
Another limited method I am aware of uses Offset, but that specifies position in printer's points rather than plot coordinates (resize the graphic to see the result of that):

Graphics[{
  AbsolutePointSize[25],
  Point @ Offset[{75, 0}, Scaled[{0, 1/2}]]
  },
 PlotRange -> {{5, 10}, {5, 10}},
 Frame -> True
]

enter image description here

enter image description here

$\endgroup$
2
  • $\begingroup$ Thanks for this. As with J.M.'s approach, it seems to require (at least in the first method) the knowledge of at least some minimum/maximum values, which I hope to avoid. $\endgroup$
    – Bernd
    Commented May 22, 2013 at 9:31
  • 3
    $\begingroup$ @Bernd Indeed, which is why I said I'd like to know the answer too. In the past I've always used some other workaround, but it's disappointing that the mixed form {abolute, Scaled[pos]} doesn't work directly. :-/ $\endgroup$
    – Mr.Wizard
    Commented May 22, 2013 at 9:34
4
+50
$\begingroup$

Following method does not require any knowledge about PlotRange because MMA knows it. :)

This function is not pretty, I suspect it will crush sometimes due to it's naive form. Report me then :)

However, it works and You can DumpSave it if You don't want to look at it. :)

 MixedCoordinates[plot_] := Composition[
  ReplaceAll[#[[1]], {
   {x_?NumericQ, Scaled@y_?NumericQ} :> {x, (#1 + Abs[#1 - #2] y) & @@ #[[2, 1, 2]]},
   {Scaled@x_?NumericQ, y_?NumericQ} :> {(#1 + Abs[#1 - #2] x) & @@ #[[2, 1, 1]], y}
  }] &,
 {#[[1]], Cases[#[[2]], x : Rule[PlotRange, _] :> x[[2]]]} &,
 {#, AbsoluteOptions@#} &
 ][plot]

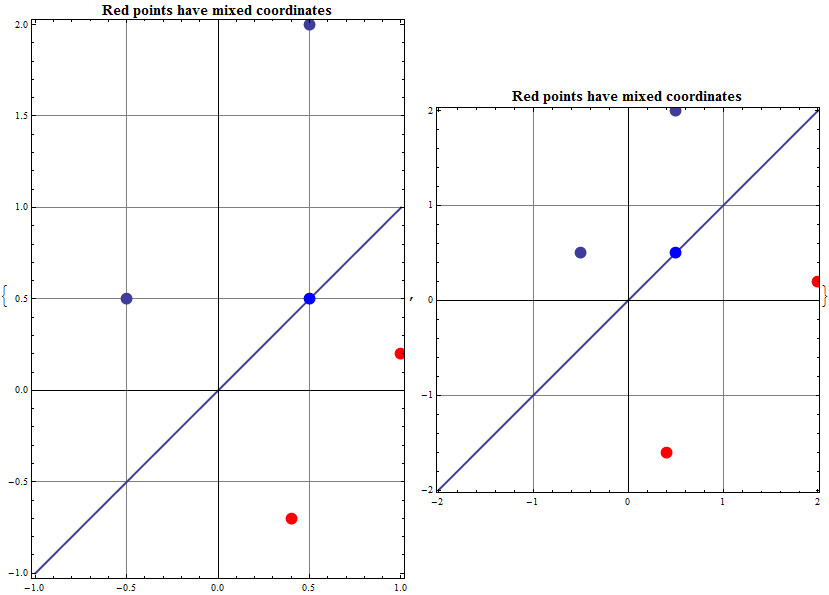
Lets test it. This two Shows have the same content, except of second argument, Plot with different domain.

MixedCoordinates@Show[
    ListPlot[{{-.5, .5}, {.5, 2}}, PlotStyle -> Directive@AbsolutePointSize@12],
    Plot[x, {x, ##}],
    Graphics[{AbsolutePointSize@12, Blue, Point[{{.5, .5}}],
              Red, Point[{{Scaled@1, .2}}]}]
    ,
    PlotLabel -> Style["Red points have mixed coordinates", Bold, 15],
    PlotRange -> All, AspectRatio -> Automatic, AxesOrigin -> {0, 0},
    Frame -> True, Epilog -> {AbsolutePointSize@12, Red, Point[{{.4, [email protected]}}]},
    ImageSize -> 400, GridLines -> Automatic, BaseStyle -> Thick
] & @@@ {{-1, 1}, {-2, 2}}

enter image description here

Possible issues:

  • PlotRange->All seems to be necessary at the end od Show
  • If You want to put Epilog somewhere, it has to be either in Show or in it's first argument. Why? Because Show takes options from it's first argument and other's arguments options are not exposed.

Short description:

MixedCoordinates@[] is taking information from PlotRange given by AbsoluteOptions. And then, with this information it is rescaling elements Scaled[_]


I do not consider it is finished, but it could be a good start. Looking forward for Your remarks.

$\endgroup$
6
  • 1
    $\begingroup$ Perhaps I'm missing something - why not use PlotRange to get the coordinate ranges in each direction? $\endgroup$ Commented Jun 21, 2013 at 21:36
  • $\begingroup$ @SimonWoods No You are not. :) I have started with this idea, then I have switched to that with FullForm, before I realized that PlotRange->All is necessary. After that I forgot about the beginning which works also good, I'll replace that, it is a little bit shorter. $\endgroup$
    – Kuba
    Commented Jun 21, 2013 at 22:54
  • $\begingroup$ Kuba, thanks for this. Since I'm not quite able to understand completely how MixedCoordinates@[] works just from reading the code: Does the ReplaceAll part manipulate any occurrence of Scaled in the Graphics it is applied to? So I should not use any other instances of Scaled? $\endgroup$
    – Bernd
    Commented Jun 24, 2013 at 7:43
  • 1
    $\begingroup$ @Bernd It should affect only Scaled[_?NumericQ] form, so You can use Scaled[{_,_},{_,_}] form somewhere else without erros but I have not tested this. $\endgroup$
    – Kuba
    Commented Jun 24, 2013 at 7:49
  • $\begingroup$ While it's not yet a perfect solution (according to Kuba's own remarks), it seems to come closest to what I am looking for (though I hoped there was a simpler way...) - so I'd award him/her the bounty? $\endgroup$
    – Bernd
    Commented Jun 27, 2013 at 7:21
2
$\begingroup$

Late answer.. I thought some might find this useful:

I had a need to also use the plot aspect ratio, so develeped this variation on @kuba's answer..

 ctransform = Module[{plotrange, plotratio, aspect},
         plotrange = Last@Cases[ AbsoluteOptions[#] , 
                          x : Rule[PlotRange, _] :> x[[2]]];
         aspect =  Last@Cases[ AbsoluteOptions[#] , 
                         x : Rule[AspectRatio, _] :> x[[2]]];
         plotratio = Divide @@ (Subtract @@ # & /@ plotrange);
         ReplaceAll[#, {
       scaleratio -> 1/plotratio/aspect,
       scalev[i_, x_] :> plotrange[[i, 1]] (1 - x) + plotrange[[i, 2]] (x)}]] &;

ctransform@
  Show[{
      Plot[ x^2 + 5, {x, 1, 5}, PlotStyle -> Thick,   PlotRange -> {{0, 6}, {0, 30}}], 
      Graphics[ Table[Circle[{i,   scalev[2, .1] + .1 i scaleratio}, 
            .1 i {1, scaleratio}], {i, 1,  5}]]},   AspectRatio -> 1/GoldenRatio, 
      PlotRange -> {{0, 6}, {0, 30}}]

Note I'm not using the bultin Scaled at all, so there is no conflict issue if yuo needed to use that for something as well.

You could also do this with Composition, but it gets a bit unwieldy

$\endgroup$
1
$\begingroup$

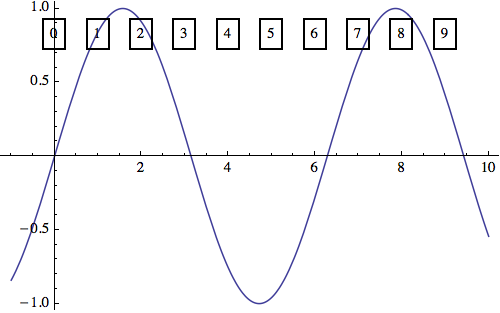
This is not exactly what you asked for, but it will work in many situations, although not in v6 :/

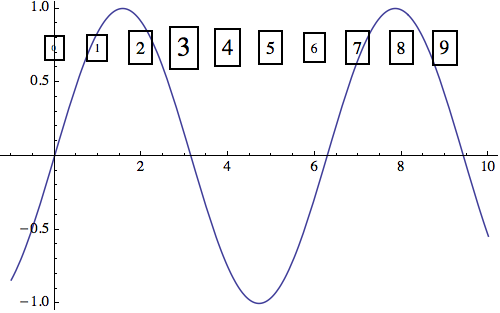
insets = Table[Framed[i], {i, 0, 9}];

plot = Plot[Sin[x], {x, -1, 10},
  Epilog -> MapIndexed[
             Translate[Inset[#1, {0, Top}, Scaled[{0.5, 1.5}]], {First@#2 - 1, 0}] &, 
             insets]
  ]

First plot

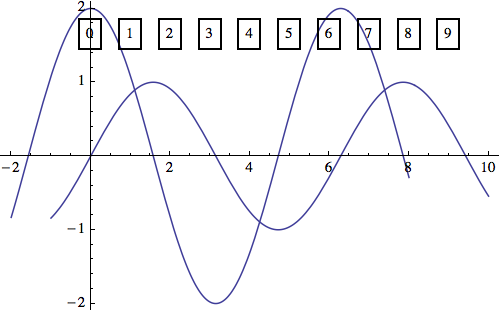
Combining with other plots, the insets move up automatically:

Show[plot, Plot[2 Cos[x], {x, -2, 8}], PlotRange -> All]

Second plot

Now the above works well if the insets all have the same vertical size. If not, one can use Pane:

SeedRandom[1];
insets2 = Table[Framed[Style[i, RandomInteger[20, 40]]], {i, 0, 9}];
vsize = Max[Rasterize[#, "RasterSize"] & /@ insets2];

Plot[Sin[x], {x, -1, 10},
 Epilog -> 
  MapIndexed[
   Translate[Inset[#1, {0, Top}, Scaled[{0.5, 1.5}]], {First@#2 - 1, 0}] &, 
   Pane[#, {Automatic, vsize}, Alignment -> Center] & /@ insets2]]

Third plot

The main way it fails to do exactly what the OP asks is that the vertical offset is relative to the (max) size of the insets, not relative to the size of the graphics.

$\endgroup$
6
  • $\begingroup$ Michael, I don't know what I'm doing wrong, but your above code doesn't yield the image you attached for me. If I run your first code snippet, I get this graph, and the second one similarly looks different. $\endgroup$
    – Bernd
    Commented Jun 24, 2013 at 7:24
  • $\begingroup$ And if I try to run the third code, I get the following error: The specified setting for the option PaneBoxOptions, ImageSize cannot be used. $\endgroup$
    – Bernd
    Commented Jun 24, 2013 at 7:25
  • $\begingroup$ @Bernd That's curious. When I cut and paste the code above, it all works just as shown, on both V8.0.4 and V9.0.1 (on a Mac). Which version of Mathematica are you using? Did you try the code with a fresh kernel? (I can get your image if I replace {0, Top} with Scaled[{0, 1}], but I don't know why your system would behave differently than mine.) $\endgroup$
    – Michael E2
    Commented Jun 24, 2013 at 12:27
  • $\begingroup$ That could indeed be the issue - I'm still on version 6. Still all the commands are already introduced in this version, so it's odd to get such a different result. A pity because I really like this proposal for its brevity. $\endgroup$
    – Bernd
    Commented Jun 25, 2013 at 8:54
  • $\begingroup$ @Bernd The reference pages say Inset and Scaled were modified in V7. Try Inset[#1, {Axis, Top}, Scaled[{0.5, 1.5}]] -- maybe it will work. There will be a problem if the axis is not at x = 0, though. But if you know where the axis is, then it might be usable. $\endgroup$
    – Michael E2
    Commented Jun 25, 2013 at 13:14

Your Answer

By clicking “Post Your Answer”, you agree to our terms of service and acknowledge you have read our privacy policy.

Not the answer you're looking for? Browse other questions tagged or ask your own question.