0
$\begingroup$

I am trying to plot the eigenvalues of the following matrix

hamil[kx_,ky_,kz_]={{-10.6`, -0.25` E^(
    I (-0.625` kx - 0.21650635094610965` ky - 
       0.43666666666666665` kz)) - 
   0.7` E^(I (0.375` kx - 0.21650635094610965` ky - 
       0.43666666666666665` kz)) - 
   0.25` E^(
    I (-0.125` kx + 0.649519052838329` ky - 0.43666666666666665` kz)),
   E^((0.` + 
      0.43666666666666676` I) kz) (-0.25` E^((0.` - 
          0.125` I) kx - (0.` + 0.649519052838329` I) ky) + 
     E^((0.` - 0.625` I) kx + (0.` + 
          0.21650635094610965` I) ky) (-0.25` - 
        0.7` E^((0.` + 1.` I) kx)))}, {E^((0.` - 
       0.375` I) kx - (0.` + 0.649519052838329` I) ky + (0.` + 
       0.43666666666666665` I) kz) (-0.25` E^((0.` + 0.5` I) kx) + 
     E^((0.` + 0.8660254037844386` I) ky) (-0.7` - 
        0.25` E^((0.` + 1.` I) kx))), -10.6`, 
  E^((0.` - 0.5` I) kx - (0.` + 0.43301270189221935` I) ky - (0.` + 
       0.43666666666666665` I) kz) (-0.25` - 
     0.25` E^((0.` + 1.` I) kx) - 
     0.7` E^((0.` + 0.5` I) kx + (0.` + 
          0.8660254037844387` I) ky))}, {E^((0.` - 
       0.375` I) kx - (0.` + 0.21650635094610965` I) ky - (0.` + 
       0.43666666666666676` I) kz) (-0.7` - 
     0.25` E^((0.` + 1.` I) kx) - 
     0.25` E^((0.` + 0.5` I) kx + (0.` + 0.8660254037844386` I) ky)), 
  E^((0.` - 0.43301270189221935` I) ky + (0.` + 
       0.43666666666666665` I) kz) (-0.7` + 
     E^((0.` - 0.5` I) kx + (0.` + 
          0.8660254037844387` I) ky) (-0.25` - 
        0.25` E^((0.` + 1.` I) kx))), -10.6`}}

Now the eigenvalues as function of kx, ky and kz are

{es1[kx_, ky_, kz_], es2[kx_, ky_, kz_], es3[kx_, ky_, kz_]} = 
  Eigenvalues[hamil[kx, ky, kz]] // FullSimplify;

Now plotting all the three eigenvalues

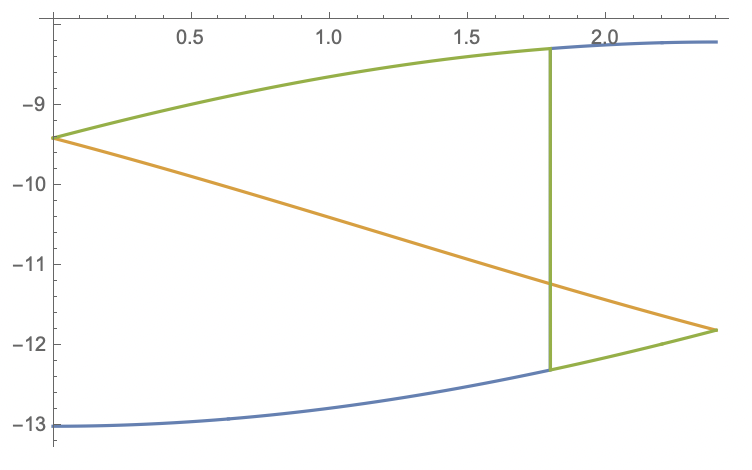
Plot[{Chop[es1[0, 0, z]], Chop[es2[0, 0, z]], Chop[es3[0, 0, z]]}, {z,
   0, \[Pi]/1.31}]

enter image description here

I don't understand why is there a sudden jump in blue plot and green plot? Is there a way to rectify this? Is this problem also occur when solving eigenfunctions?

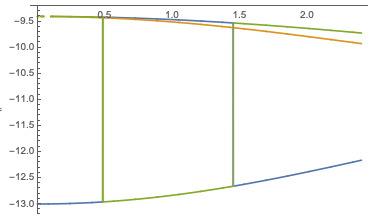
To further stating the problem, as Bob's answer suggests that changing the precision of the equation helps somewhat. However, changing the plotting variable results in same issue that is not rectified by the Bob's solution.

Plot[{Chop[es1[x, 0, 0]], Chop[es2[x, 0, 0]], Chop[es3[x, 0, 0]]}, {x,
0, \[Pi]/1.31}]

enter image description here

$\endgroup$
11
  • $\begingroup$ I cannot reproduce this (Ver 12.0.0 on OSX 10.15.7). $\endgroup$
    – march
    Commented Sep 8, 2021 at 21:48
  • $\begingroup$ @march I missed _ in front of kz in hamil function. Please check that one. I made the edits. $\endgroup$
    – sslucifer
    Commented Sep 8, 2021 at 21:49
  • $\begingroup$ I still can't reproduce the error (directly copying and running your code)! What version are you using? $\endgroup$
    – march
    Commented Sep 8, 2021 at 21:51
  • $\begingroup$ I am running in Ver 12.1.1 on OSX 11.5.2 $\endgroup$
    – sslucifer
    Commented Sep 8, 2021 at 21:58
  • 1
    $\begingroup$ @BobHanlon. I'm not sure that it's equivalent, because in the previous post, the eigenvalues cross, and switch where they cross, whereas here, they're switching at some arbitrary position. $\endgroup$
    – march
    Commented Sep 8, 2021 at 22:34

1 Answer 1

2
$\begingroup$

Reevaluating with v12.3.1, I am able to reproduce the crossover.

$Version

(* "12.3.1 for Mac OS X x86 (64-bit) (June 19, 2021)" *)

Clear["Global`*"]

hamil[kx_, ky_, kz_] = 
   {{-10.6`, -0.25` E^(I (-0.625` kx - 0.21650635094610965` ky - 
           0.43666666666666665` kz)) - 
     0.7` E^(I (0.375` kx - 0.21650635094610965` ky - 
           0.43666666666666665` kz)) - 
     0.25` E^(I (-0.125` kx + 0.649519052838329` ky - 
           0.43666666666666665` kz)), 
    E^((0.` + 
          0.43666666666666676` I) kz) (-0.25` E^((0.` - 0.125` I) kx - (0.` + 
              0.649519052838329` I) ky) + 
       E^((0.` - 0.625` I) kx + (0.` + 0.21650635094610965` I) ky) (-0.25` - 
          0.7` E^((0.` + 1.` I) kx)))}, {E^((0.` - 0.375` I) kx - (0.` + 
           0.649519052838329` I) ky + (0.` + 
           0.43666666666666665` I) kz) (-0.25` E^((0.` + 0.5` I) kx) + 
       E^((0.` + 0.8660254037844386` I) ky) (-0.7` - 
          0.25` E^((0.` + 1.` I) kx))), -10.6`, 
    E^((0.` - 0.5` I) kx - (0.` + 0.43301270189221935` I) ky - (0.` + 
           0.43666666666666665` I) kz) (-0.25` - 0.25` E^((0.` + 1.` I) kx) - 
       0.7` E^((0.` + 0.5` I) kx + (0.` + 
              0.8660254037844387` I) ky))}, {E^((0.` - 0.375` I) kx - (0.` + 
           0.21650635094610965` I) ky - (0.` + 
           0.43666666666666676` I) kz) (-0.7` - 0.25` E^((0.` + 1.` I) kx) - 
       0.25` E^((0.` + 0.5` I) kx + (0.` + 0.8660254037844386` I) ky)), 
    E^((0.` - 0.43301270189221935` I) ky + (0.` + 
           0.43666666666666665` I) kz) (-0.7` + 
       E^((0.` - 0.5` I) kx + (0.` + 0.8660254037844387` I) ky) (-0.25` - 
          0.25` E^((0.` + 1.` I) kx))), -10.6`}};

The Eigenvalues are

{es1[kx_, ky_, kz_], es2[kx_, ky_, kz_], es3[kx_, ky_, kz_]} =
  Eigenvalues[hamil[kx, ky, kz]];

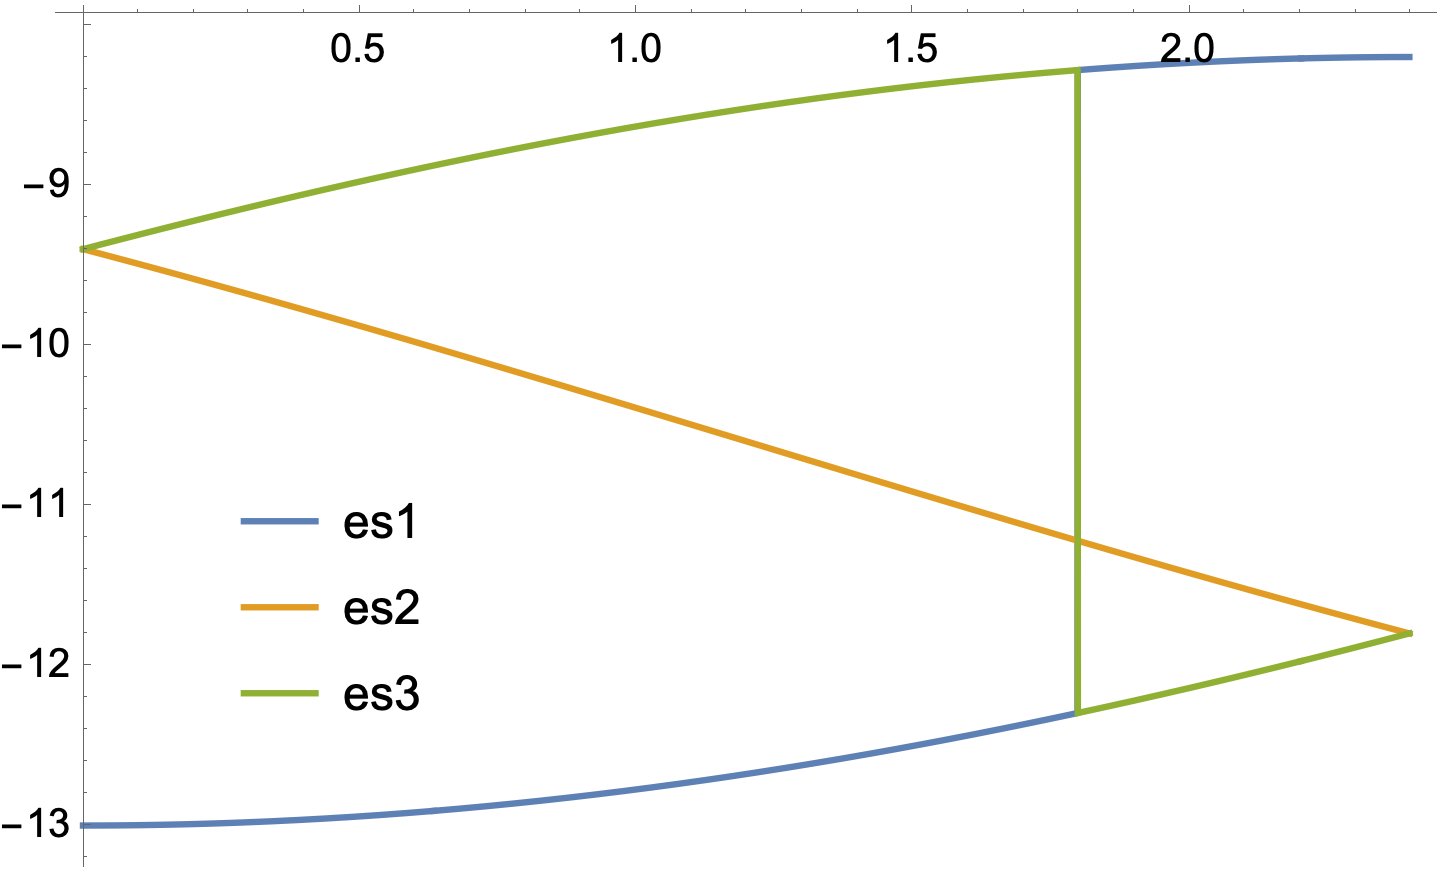
Plotting shows the crossover:

Plot[{Chop[es1[0, 0, z]], Chop[es2[0, 0, z]], Chop[es3[0, 0, z]]},
 {z, 0, π/1.31},
 PlotLegends -> Placed[{es1, es2, es3}, {.2, .3}]]

enter image description here

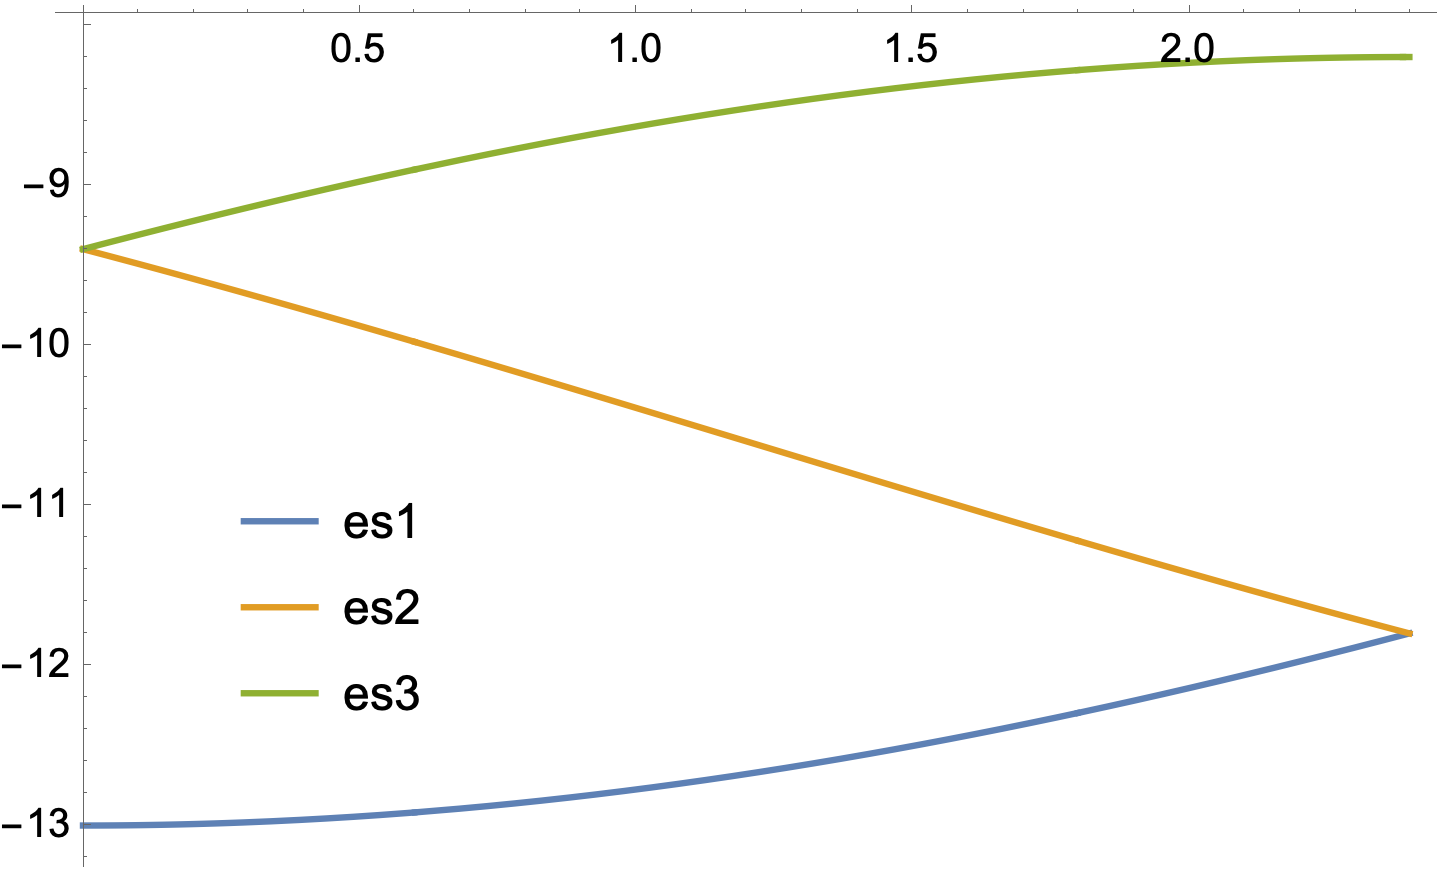
However, using arbitrary-precision instead of machine precision:

{es1p[kx_, ky_, kz_], es2p[kx_, ky_, kz_], es3p[kx_, ky_, kz_]} = 
  Eigenvalues[SetPrecision[hamil[kx, ky, kz], 15]];

Plot[{Chop[es1p[0, 0, z]], Chop[es2p[0, 0, z]], Chop[es3p[0, 0, z]]}, {z, 
  0, π/1.31},
 PlotLegends -> Placed[{es1, es2, es3}, {.2, .3}]]

enter image description here

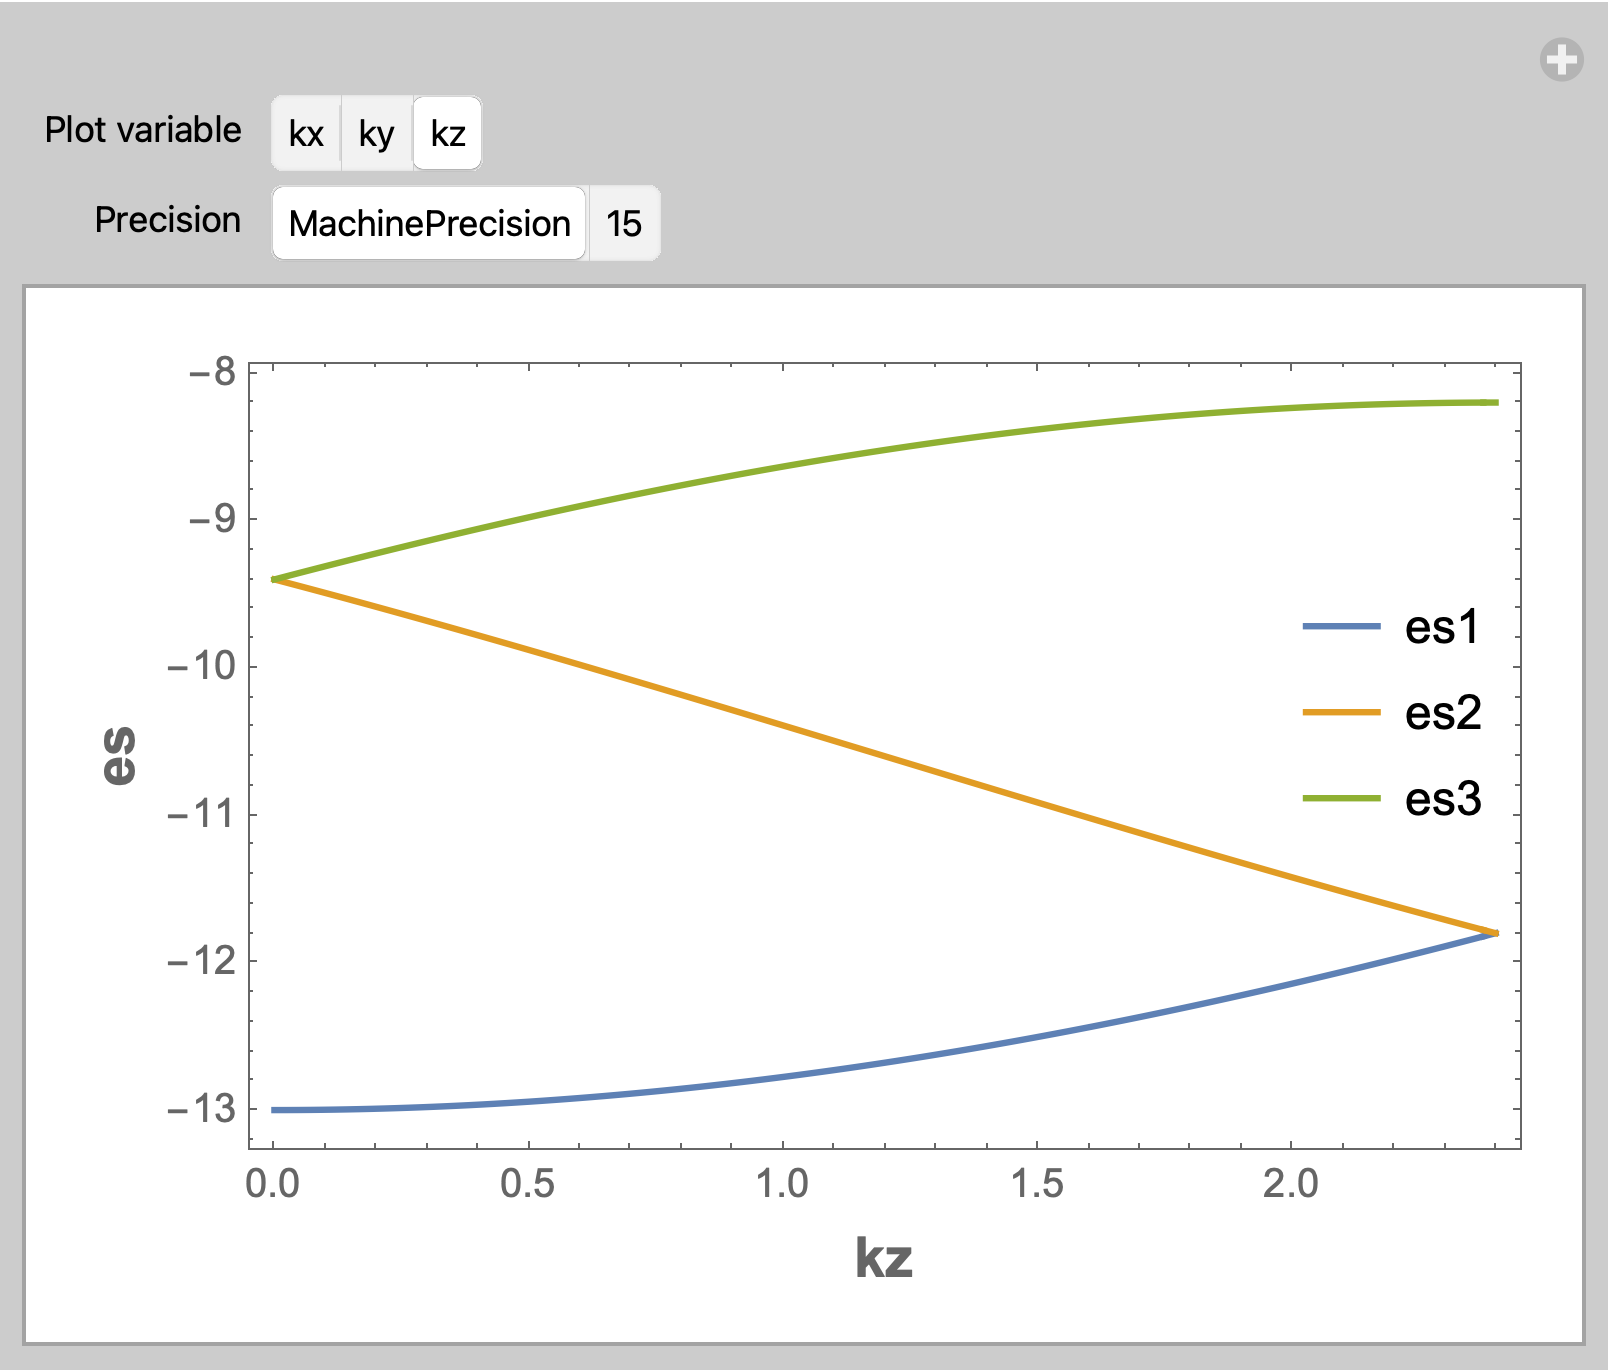
EDIT: Explicitly Sort the Eigenvalues and use ListLinePlot

Manipulate[
 Module[{args},
   args = ReplacePart[{0, 0, 0}, var -> t];
   es[t_] = Eigenvalues[
     SetPrecision[hamil @@ args, prec]];
   data = Transpose[Table[Sort@Chop@es[t], {t, 0, 100 Pi/131, Pi/131}]];
   ListLinePlot[data,
    DataRange -> {0, 100 Pi/131},
    Frame -> True,
    FrameLabel -> (Style[#, 14, Bold] & /@
       {{"kx", "ky", "kz"}[[var]], 
        "es"}),
    PlotRange -> All,
    PlotLegends ->
     Placed[{es1, es2, es3}, {.9, .55}]]] // Quiet,
 {{var, 3, "Plot variable"},
  {1 -> "kx", 2 -> "ky", 3 -> "kz"}},
 {{prec, MachinePrecision, "Precision"}, {MachinePrecision, 15}}]

enter image description here

$\endgroup$
1
  • $\begingroup$ Yeah this is what I am talking about, now if you try Plot[{Chop[es1p[x, 0, 0]], Chop[es2p[x, 0, 0]], Chop[es3p[x, 0, 0]]}, {x, 0, π/1.31}], you will again get the same problem. $\endgroup$
    – sslucifer
    Commented Sep 9, 2021 at 0:30

Your Answer

By clicking “Post Your Answer”, you agree to our terms of service and acknowledge you have read our privacy policy.

Not the answer you're looking for? Browse other questions tagged or ask your own question.