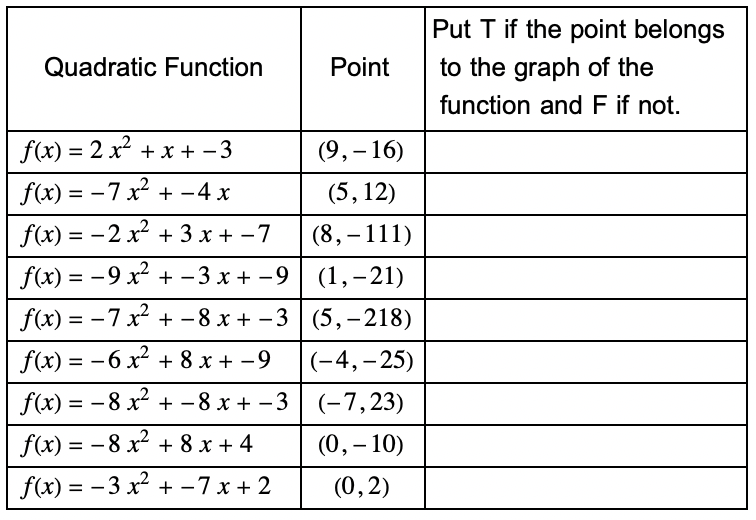
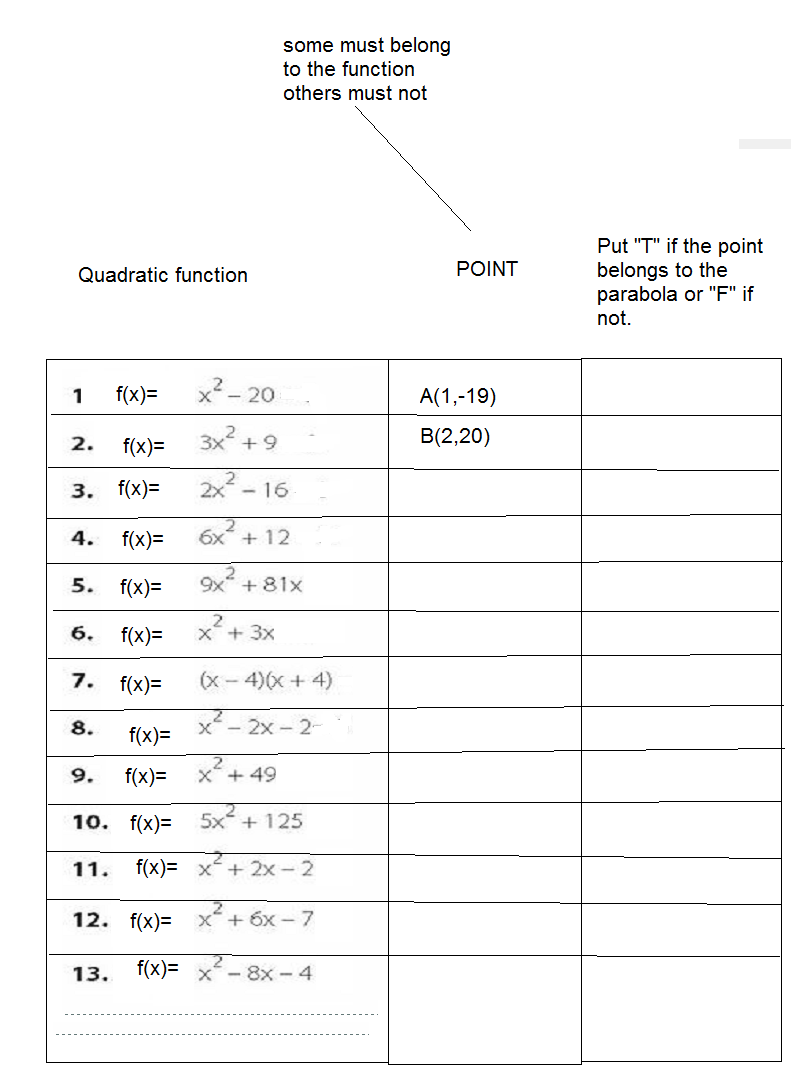
Here's an answer; there could be some cleanup done, and I need to explain why some of the auxiliary functions work. But here you go—I tried to explain how it works in inline comments along the way, so that you can simply copy-paste the whole code block and run it.
(* Given a list of coefficents {a, b, c}, make a polynomial
 function—this can be done with FromDigits. *)

makePolynomial[coeffs_List] := Evaluate[FromDigits[coeffs, #]] &

(* Example: makePolynomial[{1, 2, 3}] ==> 3 + 2 #1 + #1^2 & *)

(* Format polynomials as a function definition,
using fname and var for the lhs: *)

polynomialFormat[fname_, var_][f_] :=
 With[{poly = Reverse@Inactivate[f[var], Plus]},
  HoldForm[fname[var] = poly]]

(* Example: polynomialFormat[f, x][makePolynomial[{1, 2, 3}]] ==>
   f[x] = x^2 + 2 x + 3 *)
(* We expect to apply TraditionalForm to this to make it look nicer. *)

(* Format a 2D point as a tuple: *)

pointFormat[{x_, y_}] := Row[{"(", x, ", ", y, ")"}]

(* Again, we expect to apply TraditionalForm. *)

(* If the first argument is True, get a point from the
graph of the function; if false, get one definitely not from the graph. *)

ifGetPoint[xrange_ : {-9, 9}, yrange_ : {-25, 25}][bool_, f_] :=
 With[{x = RandomInteger[xrange]},
  If[bool,
   {x, f[x]},
   Block[{y = RandomInteger[yrange]},
    While[y == f[x], y = RandomInteger[yrange]]; {x, y}]
   ]
  ]

(* Ok, main function. We allow parameters for the range of
coefficients, the percentage of answers which should be
true, and the range in which to select a "false" point.
All but the number of rows requested can be omitted and
will take on default values.*)

ParabolaPointTableBasic[numrows_Integer?Positive,
  coefficientrange : (_Integer?Positive) : 9,
  truepercentage : (_?(0 <= # <= 1 &)) : 0.5,
  xrange : {_Integer, _Integer} : {-9, 9},
  yrange : {_Integer, _Integer} : {-25, 25}] :=
 (* First, make sure x is "fresh" for the duration of
    this evaluation, and that any external definition of x
    or f, e.g. x = 5, will not affect us. *)
 Block[{f, x},
  (* "With" is a way of saying that symbols explicitly used
     in the following expression should be repalced with
     some value (whatever we set in the following list. *)
  With[
   (* First, let's get a list with about truepercentage*
   numrows values of True, and the rest False.
   We'll do this by asking if each integer between 1 and numrows is \
below truepercentage*numrows,
   then mixing that list up with RandomSample. *)
   {truelist =
     RandomSample@Table[i <= truepercentage*numrows, {i, numrows}],
    (* Next, we'll get a list of polynomial functions.
    We generate a random list of three coefficient ranges,
    and if the leading coefficient is 0, we change it to 1,
    then apply makePolynomial. *)

    polys =
     Table[
      makePolynomial@
       Replace[{0, b_, c_} :> {1, b, c}]@
        RandomInteger[{-coefficientrange, coefficientrange},
         3], {numrows}]},
   (* We need a new "With", since we're going to now
      use the variables defined in the previous one. *)
   With[
    (* Get a point in the parabola if the corresponding
       element of truelist is True, and a point not in the
       parabola if it's false. *)
    {points =
      MapThread[ifGetPoint[xrange, yrange], {truelist, polys}]},
    (* store the "answer key" in global variable answerKey *)
    answerKey = Transpose[{polys, points, truelist}];
    (* Put it all together. We have two lists of equal length;
    that's three rows. We need a third list of just blank space.
    We need to flip it to turn those rows into columns,
    so we use Transpose.
    We also need to format the polynomials and points,
    and call them f,
    so we map those formatting functions over the lists.
    Also, prepend the headers.
    Wrap the whole thing in Grid and give it appropriate options. *)
    TraditionalForm@Grid[
      Prepend[
        Text /@ {"Quadratic Function", "Point",
          "Put T if the point belongs \n to the graph of the \n \
function and F if not."}]@
       Transpose[{polynomialFormat[f, x] /@ polys,
         pointFormat /@ points, Table["   ", {numrows}]}],
      Frame -> All,
      Alignment -> {{Left, Center, Center}, {Center,
       {Automatic}}, {1, 1} -> {Center, Center}}]
    ]
   ]
  ]

(* Test/example call: *)

ParabolaPointTableBasic[9]

(* Out: *)

Validate the answers that have been stored in answerKey:
validAnswer[{f_, {x_, y_}, answer : (True | False)}] :=
  (f[x] == y) == answer

AllTrue[answerKey, validAnswer]

(* Out (should be): True *)
Improvements we could make:
Give the optional arguments as Options instead of default arguments
Remove grid from around header elements
✓ Align $f(x)=$ to the left of each cell [added Alignment -> {{Left, Center, Center}, {Center,{Automatic}}, {1, 1} -> {Center, Center}} to Grid]
Generate values that are in the function range (considered over the xrange) instead of a predetermined range, so that they seem more realistic
✓ Store the "answer key" as well as the computational content in a global variable somewhere for the instructor [declared variable answerKey]
Make storing the answer key optional and controlled by an option
✓ Include way of validating the answer key [via validAnswer for a single triple of {function, point, answer}, and then AllTrue[answerKey, validAnswer]]
Make it interactive, so that someone could choose True or False in the actual mathematica notebook
Provide an "Export" button for exporting it as a given filetype
Provide manipulation options for individual elements/the ability to "refresh" individual rows
Include optional numbering of rows along the side
Hope this helps; it was fun! Let me know if there's anything you'd like me to explain or change.


TableorArrayrather thanForloops—Forloops are unFortunate even for procedural programming, but especially so for building lists. You should also avoidPrint, and instead simply apply formatting functions to your output—I suspectGridin this case might be part of what you want. Also check outRowand the like, which can be nested insideGrid. $\endgroup$