There is actually a function in Mathematica designed for plotting the roots of polynomials. It's called RootLocusPlot and it plots the roots of a collection of polynomials parameterized by a parameter k. This can be used as follows:
poly = s^4 + k s;
RootLocusPlot[k Ratios[CoefficientList[poly, k]], {k, 0, 1}]
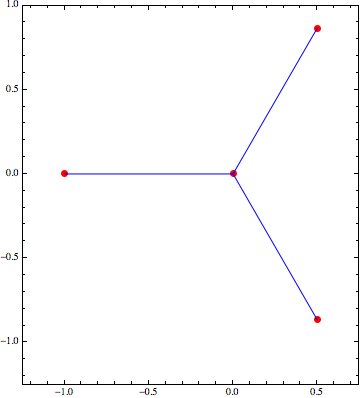
where I've defined the polynomial and let k vary from 0 to 1. The output of the function is
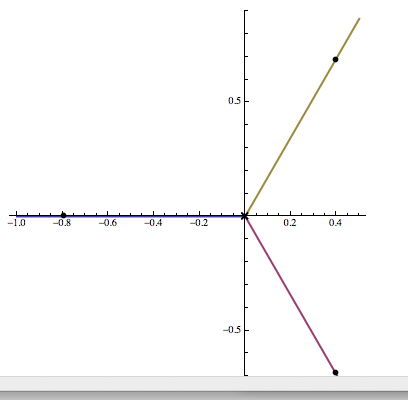
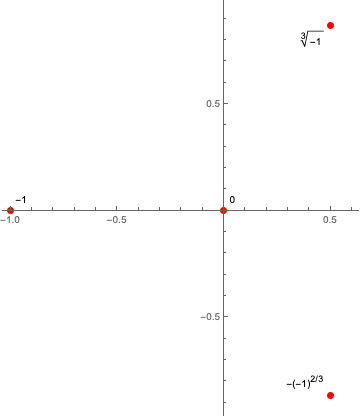
What you are seeing is that when k=0 all four roots are at the origin. As k increases, one stays at the origin and the other three move out towards their final places (where the dots are) at k=1. As Szabolcs suggests, it might be a bit hard to find this function, because it is commonly used by control engineers to examine the stability of systems (which depends on the roots of polynomials). Nonetheless, the second example in the help file under Applications shows how it can be used (as above) for regular polynomials.
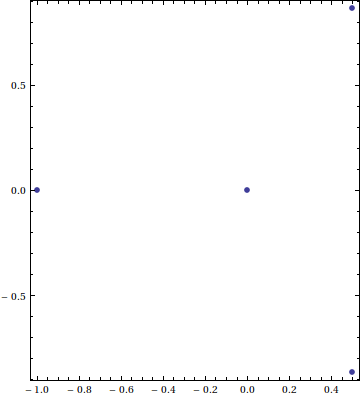
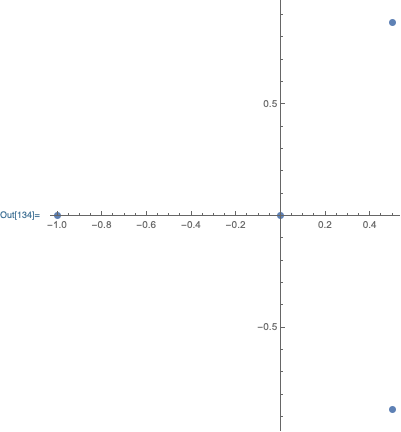
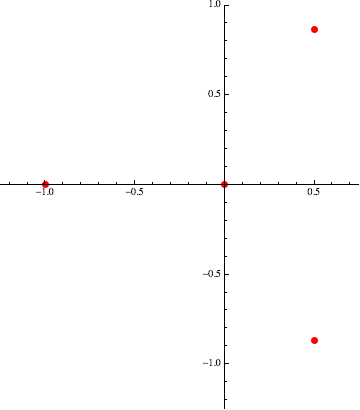
As Suba Thomas points out in the comments, you could also use the syntax:
RootLocusPlot[1/poly, {k, 0, 1}, FeedbackType -> None]
to get the same plot.


ContourPlotlike here : mathematica.stackexchange.com/questions/3886/… $\endgroup$