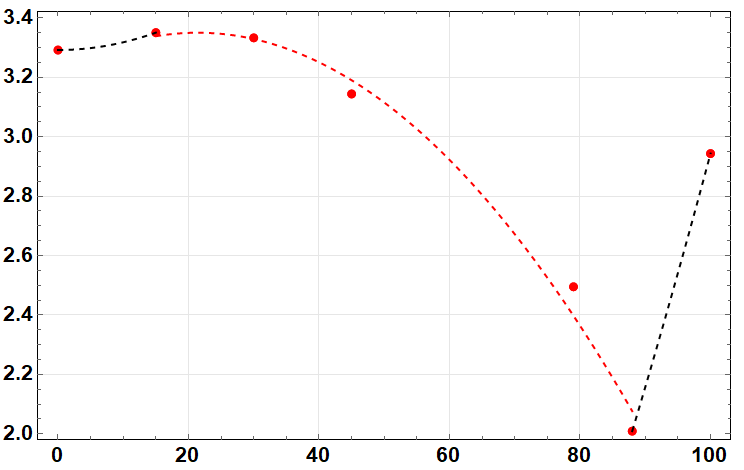
If I have the following data:
 lengthscale1SB = {{0, 3.2921487465109793`}};
lengthscale2SB = {{100, 2.9436520687559216`}};
lengthscalemix1SB = {{79, 2.495395024671054`}};
lengthscalemix2SB = {{30, 3.333075533653907`}};
lengthscalemix3SB = {{45, 3.1442955345260786`}};
lengthscalemix4SB = {{88, 2.009572697828747`}};
lengthscalemix5SB = {{15, 3.3506633046912224`}};
How can I fit it to a cubic spline?
The idea is to try to fit or provide a guide to the eye line to that data perhaps similar to this:
(* Plot can be generated as:
Show[
 ListPlot[List /@ {lengthscale1SB[[1]]}, Frame -> True,
  FrameStyle -> 16, Axes -> False, GridLines -> Automatic,
  GridLinesStyle -> Lighter[Gray, .8],
  FrameTicks -> {Automatic, Automatic}, ImageSize -> Large,
  LabelStyle -> {Black, Bold, 14}, PlotStyle -> {Red, Cyan, Gray},
  PlotLegends ->
   Placed[PointLegend[Automatic, Defer /@ qDSClabel,
     LegendMarkers -> {Row[{Style["\[FilledCircle]", 12],
         Style["\[FilledUpTriangle]", 16]}, Spacer[2]], 12},
     LegendMarkerSize -> {30, 20}, Spacings -> {.8, 0}], {0.12,
     0.25}]],

 ListPlot[List /@ {lengthscale2SB[[1]]},
  PlotStyle -> {Red, Cyan, Gray}],

 ListPlot[List /@ {lengthscalemix1SB[[1]]},
  PlotStyle -> {Red, Cyan, Gray}],

 ListPlot[List /@ {lengthscalemix2SB[[1]]},
  PlotStyle -> {Red, Cyan, Gray}],

 ListPlot[List /@ {lengthscalemix3SB[[1]]},
  PlotStyle -> {Red, Cyan, Gray}],

 ListPlot[List /@ {lengthscalemix4SB[[1]]},
  PlotStyle -> {Red, Cyan, Gray}],

 ListPlot[List /@ {lengthscalemix5SB[[1]]},
  PlotStyle -> {Red, Cyan, Gray}],

 PlotRange -> {{-1, 101}, All}

 ]
*)


CubicSplineInterpolation. From the documentation page, it appears that many cubic spline methods are implemented within it! $\endgroup$BSplineCurve@jointarrayinEpilog. Where thejointarrayis a list with all desired points included. $\endgroup$CubicSplineInterpolationis what you want. If the data is put into a single list nameddata, then the following will do what you want:f = ResourceFunction["CubicSplineInterpolation"][data]; Show[ListPlot[data], Plot[f[x], {x, 0, 100}]]. $\endgroup$