0
$\begingroup$

Suppose I have two plots: one which is a generic curve, the other is a box whisker chart of data. How can I overlay the two (with the outliers removed)?

randGen = RandomReal[{0, 1}, {10, 100}];
p1 = Plot[1 - x, {x, 0, 1}, Frame -> True, FrameLabel -> {"x", "y"}]
BoxWhiskerChart[randGen,
 "Outliers",
 ChartStyle -> "Pastel",
 FrameLabel -> {"", "x"}]

If possible, is it easy to invert the axis of the box-whisker chart so that the y-axis becomes the x-axis? The y-coordinate of the box plots will be fed by a list.

$\endgroup$

1 Answer 1

3
$\begingroup$

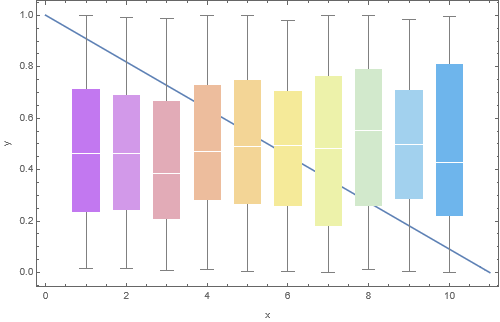
You can combine two plots by using Show:

randGen = RandomReal[{0, 1}, {10, 100}];
p1 = Plot[1 - x/10, {x, 0, 10}, Frame -> True, FrameLabel -> {"x", "y"}];
p2 = BoxWhiskerChart[randGen, ChartStyle -> "Pastel", 
   FrameLabel -> {"", "x"}];
Show[p1, p2]

Combining two plots.

Note that I have scaled the curve and changed the range. To hide the outliers, I have removed "Outliers".

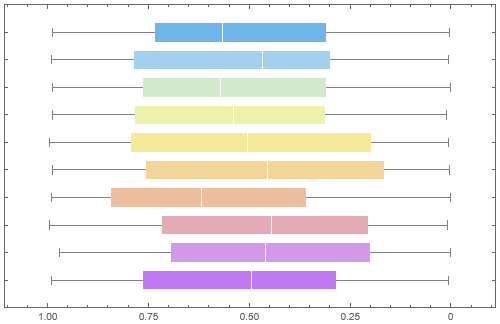
To swap the axes, use the option BarOrigin:

BoxWhiskerChart[randGen, ChartStyle -> "Pastel", BarOrigin -> Right]

Swaping axes.

However, the boxes will be stacked one on another with the spacing that you can control with the option BarSpacing. There seems to be no easy way to manually provide the $y$ coordinates of the boxes.

$\endgroup$

Your Answer

By clicking “Post Your Answer”, you agree to our terms of service and acknowledge you have read our privacy policy.

Not the answer you're looking for? Browse other questions tagged or ask your own question.