1
$\begingroup$

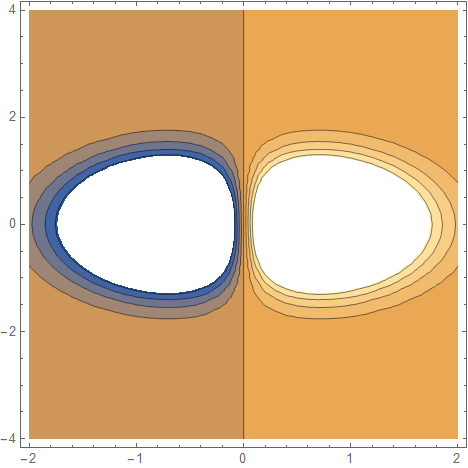
I tried to plot the following curves in Mathematica using "ListContourPlot" , and compared them with the results from Matlab 2019a.

Mathematica code: (cite from Reference (1))

meshgrid[x_List, y_List] := {ConstantArray[x, Length[x]], 
  Transpose@ConstantArray[y, Length[y]]}

{xx, yy} = meshgrid[Range[-2, 2, 0.1], Range[-4, 4, 0.2]];
c = xx*Exp[-xx^2 - yy^2];

pts = Flatten[{xx, yy, c}, {2, 3}];

ListContourPlot[pts]

Mathematica results

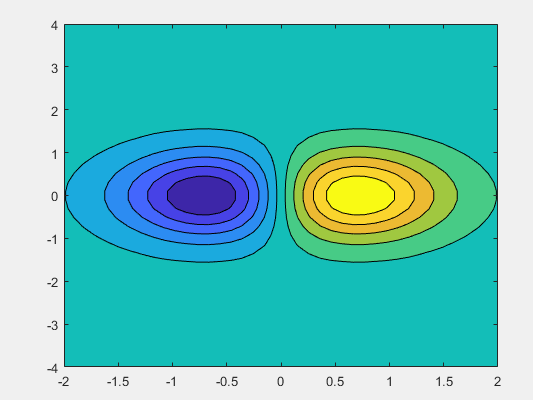
Matlab code:

x = linspace(-2,2,40);
y = linspace(-4,4,40);
[X,Y] = meshgrid(x,y);
Z = X .* exp(-X.^2 - Y.^2);
contourf(X,Y,Z,10)

Matlab results

The plotting effects from both softwares are not the same.

My question is how can we have the ContourPlot effects (this example) like those in Matlab?

References:

(1). Simulate MATLAB's meshgrid function

(2). Filled 2-D contour plot

$\endgroup$
8
  • 1
    $\begingroup$ how about ListContourPlot[pts, PlotRange -> All, Contours -> 10, ColorFunction -> "BlueGreenYellow"]? $\endgroup$
    – kglr
    Commented May 28, 2021 at 0:28
  • $\begingroup$ @kglr this methd is not good, because two eclipses are too small... $\endgroup$
    – ABCDEMMM
    Commented May 28, 2021 at 0:33
  • 1
    $\begingroup$ try also the option Contours -> DeleteCases[0][Subdivide[-3, 3, 10]/10]? $\endgroup$
    – kglr
    Commented May 28, 2021 at 0:44
  • $\begingroup$ @kglr thanks a lot for your suggestion, it is imporved, but the external circles are still too small, you may take a look at the matlab plot results. $\endgroup$
    – ABCDEMMM
    Commented May 28, 2021 at 0:46
  • $\begingroup$ @ABCDEMMM ListContourPlot[pts, PlotRange -> All, Contours -> DeleteCases[0][Subdivide[-3, 3, 10]/10], ColorFunction -> "BlueGreenYellow", AspectRatio -> 1/GoldenRatio] $\endgroup$
    – cvgmt
    Commented May 28, 2021 at 2:00

1 Answer 1

6
$\begingroup$

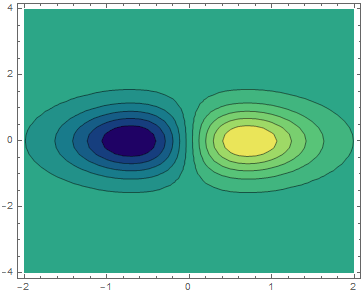
I guess this is something you want to get:

scaling = 0.80;
ListContourPlot[
  pts,
  PlotRange -> All,
  ColorFunction -> "BlueGreenYellow",
  Contours -> Subdivide[scaling Min[Last /@ pts], scaling Max[Last /@ pts], 9],
  AspectRatio -> 0.8
]

enter image description here

$\endgroup$
12
  • $\begingroup$ in addition, is there a mathematica command like "meshgrid" in matlab? $\endgroup$
    – ABCDEMMM
    Commented May 28, 2021 at 3:00
  • 1
    $\begingroup$ @ABCDEMMM Are you looking for Outer[List, array1, array2] or CoordinateBoundsArray? $\endgroup$
    – b3m2a1
    Commented May 28, 2021 at 3:06
  • $\begingroup$ @b3m2a1 I got the point that you mean for this question! thanks! $\endgroup$
    – ABCDEMMM
    Commented May 28, 2021 at 3:08
  • $\begingroup$ Is there a mathematica command like "meshgrid" in matlab? ClearAll["Global*"] meshgrid[x_List, y_List] := {ConstantArray[x, Length[x]], Transpose@ConstantArray[y, Length[y]]} {xx, yy} = meshgrid[Range[-2, 2, 0.1], Range[-4, 4, 0.2]]; c = xx*Exp[-xx^2 - yy^2]; pts = Flatten[{xx, yy, c}, {2, 3}]; Using CoordinateBoundsArray` grid = Transpose@CoordinateBoundsArray[{{-2, 2}, {-4, 4}}, {0.1, 0.2}]; c1 = Apply[#1 Exp[-#1^2 - #2^2] &, grid, {2}]; pts1 = Flatten /@ Flatten[{grid, c1}, {2, 3}]; Using Outer grid2 = Transpose@Outer[List, Range[-2, 2, 0.1], Range[-4, 4, 0.2]]; c2 = Apply[#1 Exp[-# $\endgroup$ Commented May 28, 2021 at 4:05
  • $\begingroup$ how to automatically find the scaling value? $\endgroup$
    – ABCDEMMM
    Commented May 28, 2021 at 4:18

Your Answer

By clicking “Post Your Answer”, you agree to our terms of service and acknowledge you have read our privacy policy.

Not the answer you're looking for? Browse other questions tagged or ask your own question.