16
$\begingroup$

To give some context, this problem is related to music theory.

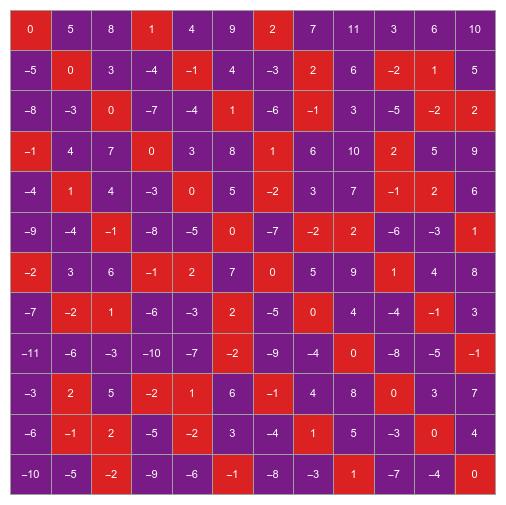
I have a matrix I'm generating with this code:

row = {0, 5, 8, 1, 4, 9, 2, 7, 11, 3, 6, 10};
m = Table[row[[j]] - row[[i]], {i, 1, 12}, {j, 1, 12}];
m // MatrixForm

(Note row can be any permutation of integers from 0 to 11 starting with 0.)

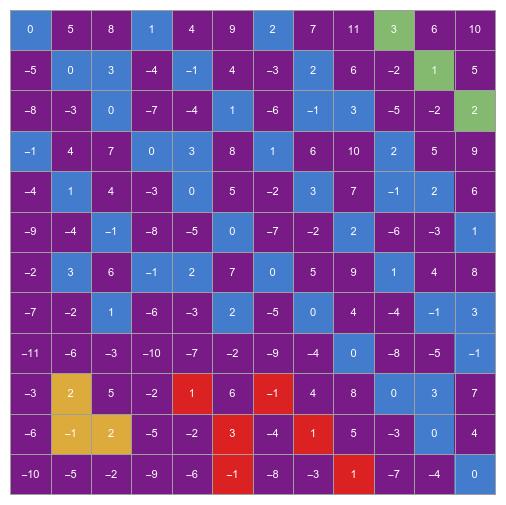
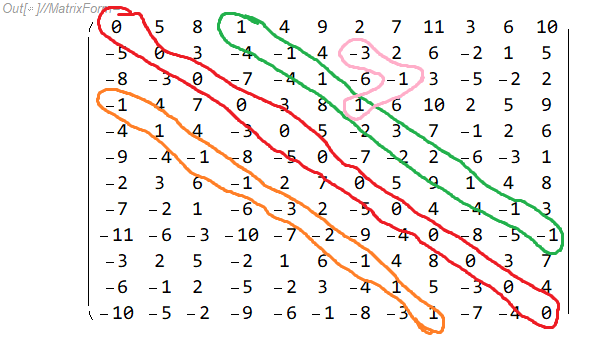
I want to find all the "chains" or "snakes" of numbers in the outputted matrix made by connecting adjacent numbers that differ by less than some delta. Basically, all the paths that exist on the matrix where each node differs by less than some number. Here is an example of some "chains" or "snakes" with delta <= 2 I found by hand in the matrix generated from row = {0, 5, 8, 1, 4, 9, 2, 7, 11, 3, 6, 10}:

enter image description here

Obviously, you have the trivial "chain" or "snake" of zeroes of the diagonal, but then you have the rest of them. I don't know where to go from here. I don't know how to represent the matrix, and then what functions to use to find the "chains" or "snakes." If I can just output them as a list of lists, that would be fine.

$\endgroup$
3
  • 2
    $\begingroup$ Interesting question! We probably need a few more details about how you want to handle certain cases, though: How do you want to handle the cycles (loops) in your graph? Can a "chain" contain the same number more than once? (Note that if you have a cycle in your graph, and you can repeat numbers, then the number of paths is infinite, since you can loop around the cycle an arbitrarily large number of times.) Can a chain double back on itself? Does a "chain" have to be maximal, or could I (for example) start at the 3 in the middle of your green "snake" and end at the -1 in the pink one? $\endgroup$ Commented May 12, 2021 at 21:31
  • $\begingroup$ This is interesting. I'd like to learn how it relates to music theory. Can you provide a brief explanation or a reference to that information? $\endgroup$ Commented May 18, 2021 at 20:03
  • $\begingroup$ @Ralph Dratman jan.ucc.nau.edu/krr2/12tone/12tone1.html $\endgroup$
    – Eriek
    Commented May 29, 2021 at 19:11

4 Answers 4

19
$\begingroup$

Maybe someone can build on this to actually get all such paths, but in the meantime, here's something to get you started! Here's how you can get a graph whose vertices are elements of the matrix at position $i,j$ (in the form {{i, j}, value}) and whose edges connect neighbors whose absolute difference is less than or equal to some delta:

(* turn a matrix into a list of elements of the form {{i, j}, value}: *)

flattenindex[mat_] := Flatten[MapIndexed[{#2, #1} &, mat, {2}], 1]

(* get a list of undirected edges: *)

dneighbors[mat_, delta_] := 
 UndirectedEdge @@@ 
  Select[Subsets[flattenindex[mat], {2}], 
   Norm[First@First[#] - First@Last[#], Infinity] == 1 && 
     Abs[Last@First[#] - Last@Last[#]] <= delta &]

(* view the graph with vertex labels of the form value_position: *)

g = dneighbors[m, 2];

Graph[g, VertexLabels -> {x_ :> Subscript[Last[x], Sequence @@ First[x]]}]

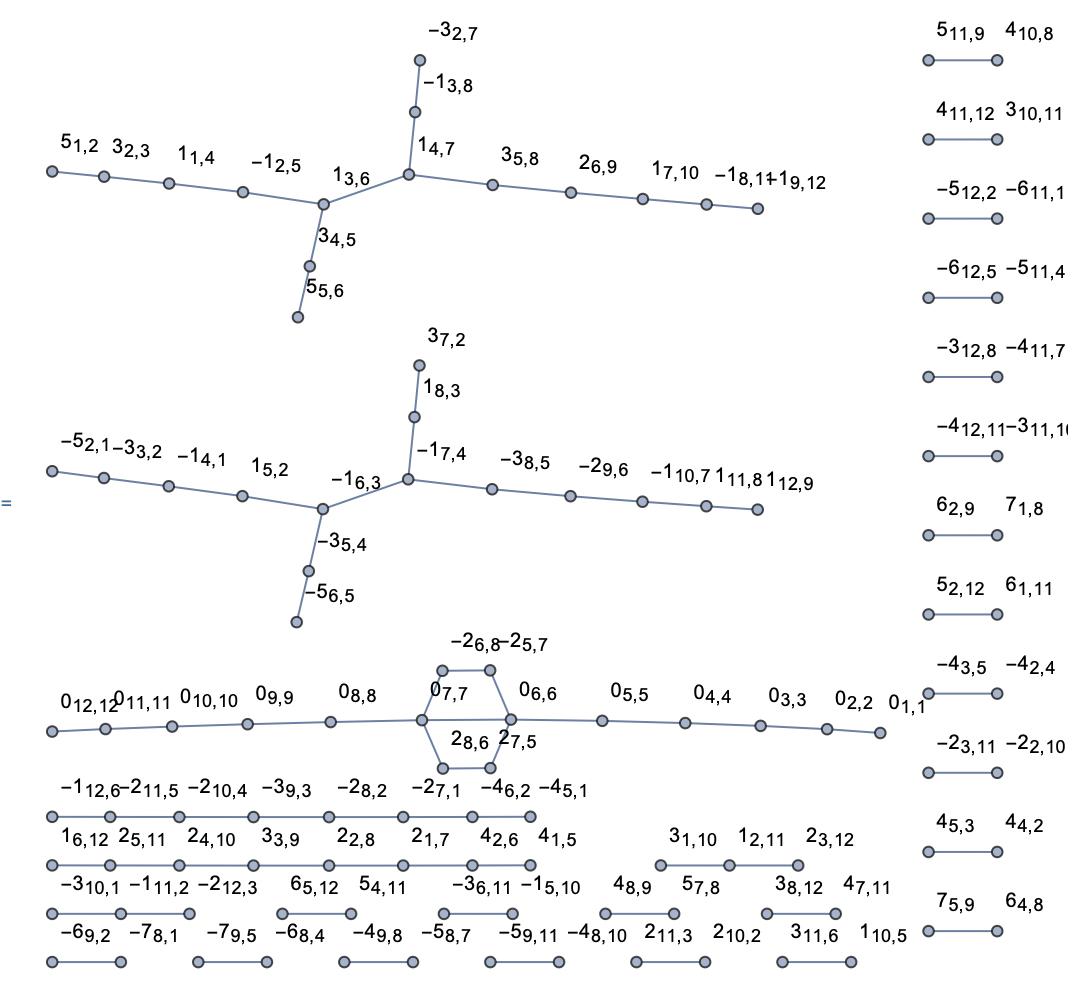
the output of the first evaluation of Graph

(* view the graph with values in their "matrix" positions: *)

Graph[g, VertexLabels -> {x_ :> Last[x]},
  VertexCoordinates -> ({#2, -#1} & @@ First[#] &) /@ VertexList[g]]

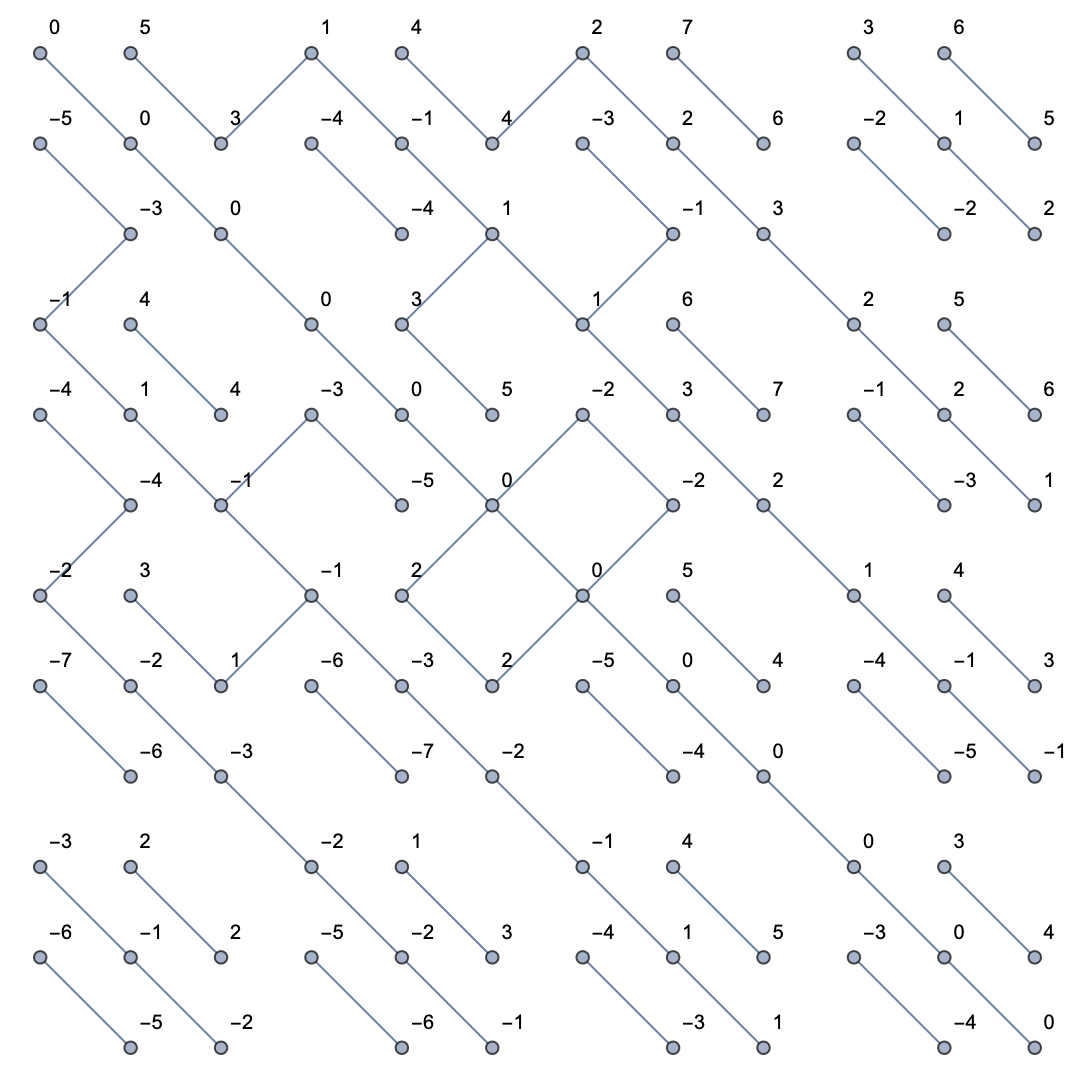
the output of the second evaluation of Graph There are more efficient non-Select ways of doing this, but since your matrix is small, it should be ok.

One could maybe actually get a list of all chains exhaustively by evaluating FindPath[g, v0, v1, Infinity, All] for all pairs of vertices v0 and v1 in the resulting graph g, and then removing all paths that are not maximal—but I expect there's a better way!

$\endgroup$
4
  • 1
    $\begingroup$ That's awesome. Wonderful stuff. Just a very minor comment. There's a missing bracket in the Graph command at the end. $\endgroup$
    – user49048
    Commented May 12, 2021 at 21:19
  • 1
    $\begingroup$ @DiSp0sablE_H3r0 ah, thank you very much! I had copied it in two parts and missed it. :) $\endgroup$
    – thorimur
    Commented May 12, 2021 at 21:20
  • 1
    $\begingroup$ NearestGraph or RelationGraph might come in handy. $\endgroup$
    – flinty
    Commented May 12, 2021 at 21:40
  • 1
    $\begingroup$ ah, RelationGraph is cleaner, but it leaves in vertices that are not connected to anything! for what it's worth, though, here's what that would look like: dneighbors[mat_, delta_] := RelationGraph[ Norm[First@#1 - First@#2, Infinity] == 1 && Abs[Last@#1 - Last@#2] <= delta &, flattenindex[mat]] $\endgroup$
    – thorimur
    Commented May 12, 2021 at 21:53
8
$\begingroup$

Following up on thorimur's excellent answer, here's some code that appears to work once you have defined the graph g in that answer. It can probably be optimized quite a bit more than its current state; in particular, I still don't quite know why I had to invoke Flatten twice in one command.

The heart of this is the FindPath function, which does not appear to allow for repeated vertices. If you want to handle loops differently, or allow for doubling back, then this code won't work.

(* Define a minimum and maximum length for the paths we're interested in *)
minlength = 5;
maxlength = Infinity;

(* Find all the connected components of the graph *)
components = ConnectedComponents[g];

(* Find all the pairs of endpoints of each components, i.e., vertices of degree 1. *)
(* Note that a "maximal" chain must go from one such vertex to another such vertex. *)
endpoints[comp_] := Select[comp, VertexDegree[g, #] == 1 &]
Flatten[Flatten[Subsets[endpoints[#], {2}] & /@ components, {2}], 1]

(* Find all the paths between the pairs of vertices we found above. *)
(* This output can be quite long if minlength is small. *)
paths = Flatten[FindPath[g, #[[1]], #[[2]], {minlength, maxlength}, All] & /@ %, 1]

(* Display the paths *)

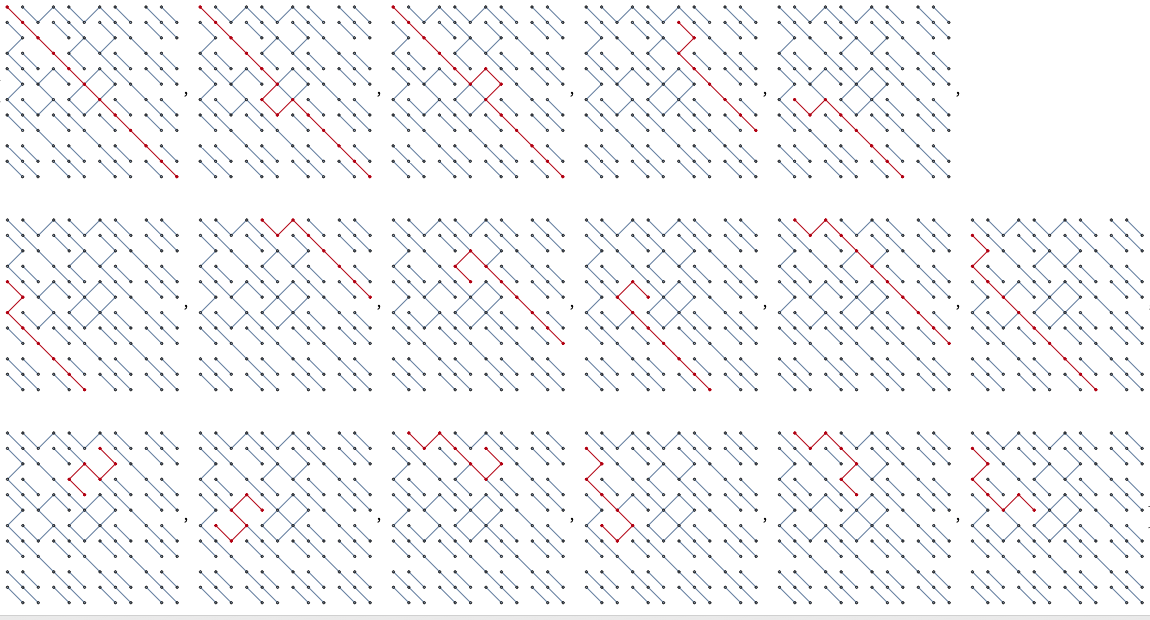
HighlightGraph[g, PathGraph[#], VertexCoordinates -> ({#2, -#1} & @@ First[#] &) /@ VertexList[g]] & /@ paths

enter image description here

$\endgroup$
6
$\begingroup$

To select over a table tabthe elements differing from base for delta showing them in clusters.

ClearAll["Global`*"]
selection[tab_List, ref_, delta_] := 
 Module[{list = {}, select = {}, n = Length[tab], m, i, j, knot, i0, j0},
  For[i = 1, i <= n, i++,
   For[j = 1, j <= n, j++,
    AppendTo[list, {tab[[i, j]], i, j}]
    ]
   ];
  m = Length[list];
  For[i = 1, i <= m, i++,
   If[Abs[ref - list[[i, 1]]] <=  delta, 
    {knot, i0, j0} = list[[i]];
    AppendTo[select, {i0, j0}]
    ]
   ];
  Return[select]
  ]

mdist[elem_, pool_List] := Module[{i}, 
 For[i = 1, i <= Length[pool], i++,
   If[Max[Abs[pool[[i]] - elem]] == 1 , Return[True]]
   ];
  Return[False]
  ]

Clear[contiguous]
contiguous[select_List] := Module[{prox, i, select1, lenant = 0},
  select1 = select;
  prox = {select1[[1]]};
  While[Length[prox] > lenant,
   lenant = Length[prox];
   select1 = Complement[select1, prox];
   For[i = 1, i <= Length[select1], i++,
    If[mdist[select1[[i]], prox],
     AppendTo[prox, select1[[i]]];
     ]
    ]
   ];
  Return[prox]
  ]

The main procedure

row = {0, 5, 8, 1, 4, 9, 2, 7, 11, 3, 6, 10};
n = 12;
tab = Table[row[[j]] - row[[i]], {i, 1, n}, {j, 1, n}];
base = 1;
delta = 2;
select = selection[tab, base, delta];
islands = {};
While[Length[select] > 0,
 prox = contiguous[select];
 AppendTo[islands, prox];
 select = Complement[select, prox]
 ]

And finally the graphic representation

classes = Table[0, n, n];
For[i = 1, i <= Length[islands], i++, prox = islands[[i]]; 
 np = Length[prox]; 
 If[np > 1, 
  For[j = 1, j <= Length[prox], j++, {i0, j0} = prox[[j]]; 
   classes[[i0, j0]] = i]]]
gr0 = ArrayPlot[classes, Mesh -> True, ColorFunction -> "Rainbow"];
numbers = Graphics[{Red, Table[Text[StringJoin[ToString /@ {tab[[n - i + 1, j]]}], {j - 0.5, i - 0.5}], {j, 1, n}, {i, 1, n}]}];
Show[gr0, numbers]

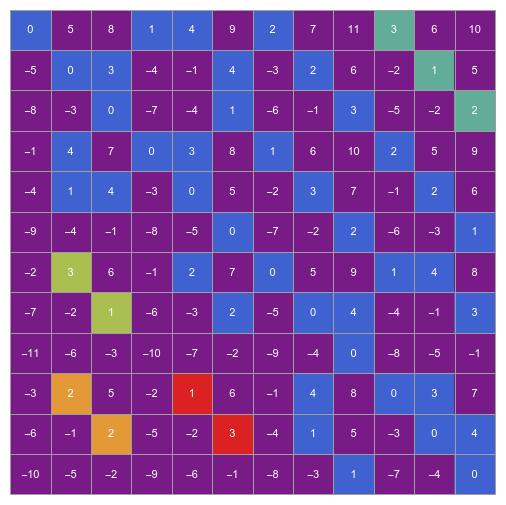
For base = 1 and delta = 2

enter image description here

and for base = 0 and delta = 2

enter image description here

and finally, for base = 2 and delta = 2

enter image description here

$\endgroup$
3
$\begingroup$

This interesting question doesn't let me go.

I tried to solve the problem using FindClusters (Thanks @flinty 's comment)

clus =FindClusters[flattenindex[m], 
DistanceFunction -> (Which[ChessboardDistance[First[#1 ], First[#2]] == 1 &&Norm[Last[#1] - Last[#2 ]] <= 2, 0, True, 1]  & )] 

The result

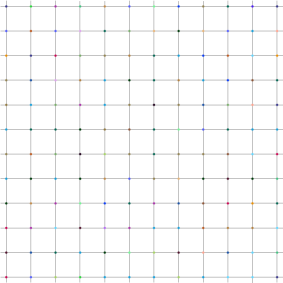
Graphics[Table[{RandomColor[],   Point@clusi[[All, 1]]},{clusi,clus }], GridLines -> {Range[1, 12], Range[1, 12]}]

enter image description here

unfortunately contains all clusters found.

Is it possible to select only the sub-clusters with DistanceFunction==0 ?

Thanks!

$\endgroup$
2
  • $\begingroup$ Your distance function has == and && in it, so it's a boolean expression and doesn't return a number. $\endgroup$
    – flinty
    Commented May 14, 2021 at 10:55
  • $\begingroup$ @flinty Thanks, that means I have to look for suitable DistanceFunction $\endgroup$ Commented May 14, 2021 at 11:25

Your Answer

By clicking “Post Your Answer”, you agree to our terms of service and acknowledge you have read our privacy policy.

Not the answer you're looking for? Browse other questions tagged or ask your own question.