As already been advised in the comments:
- Don't use
N - it is reserved.
- Use
E instead of e. e is just a parameter.
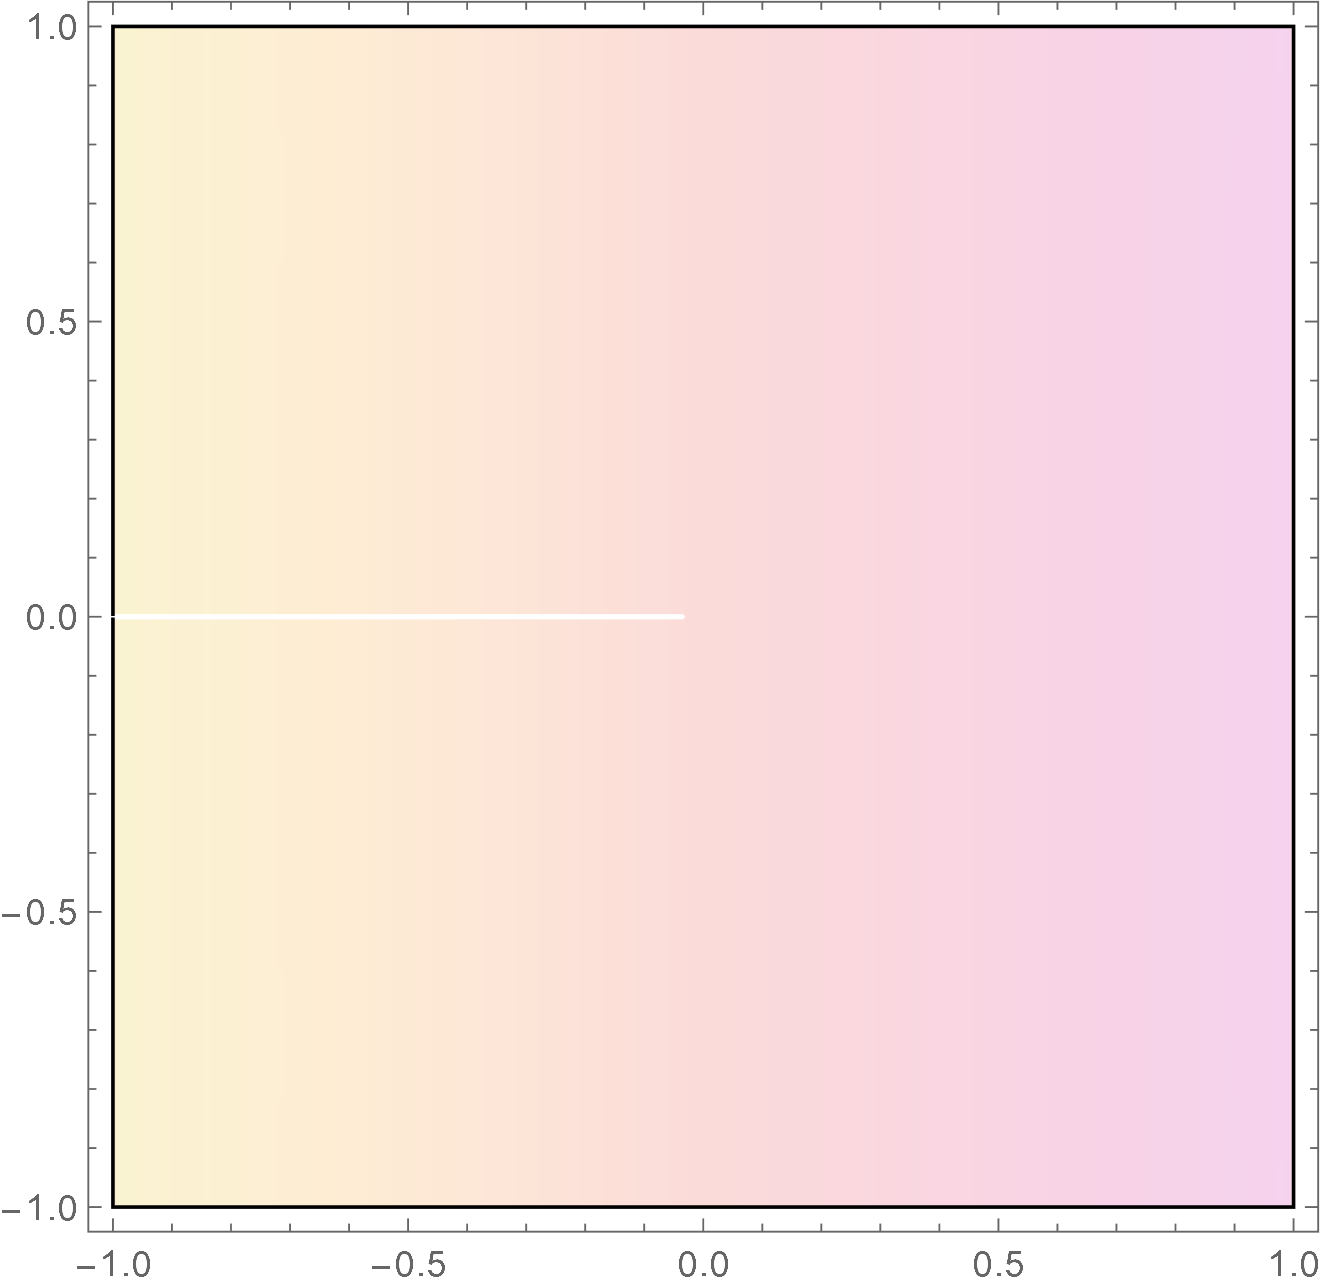
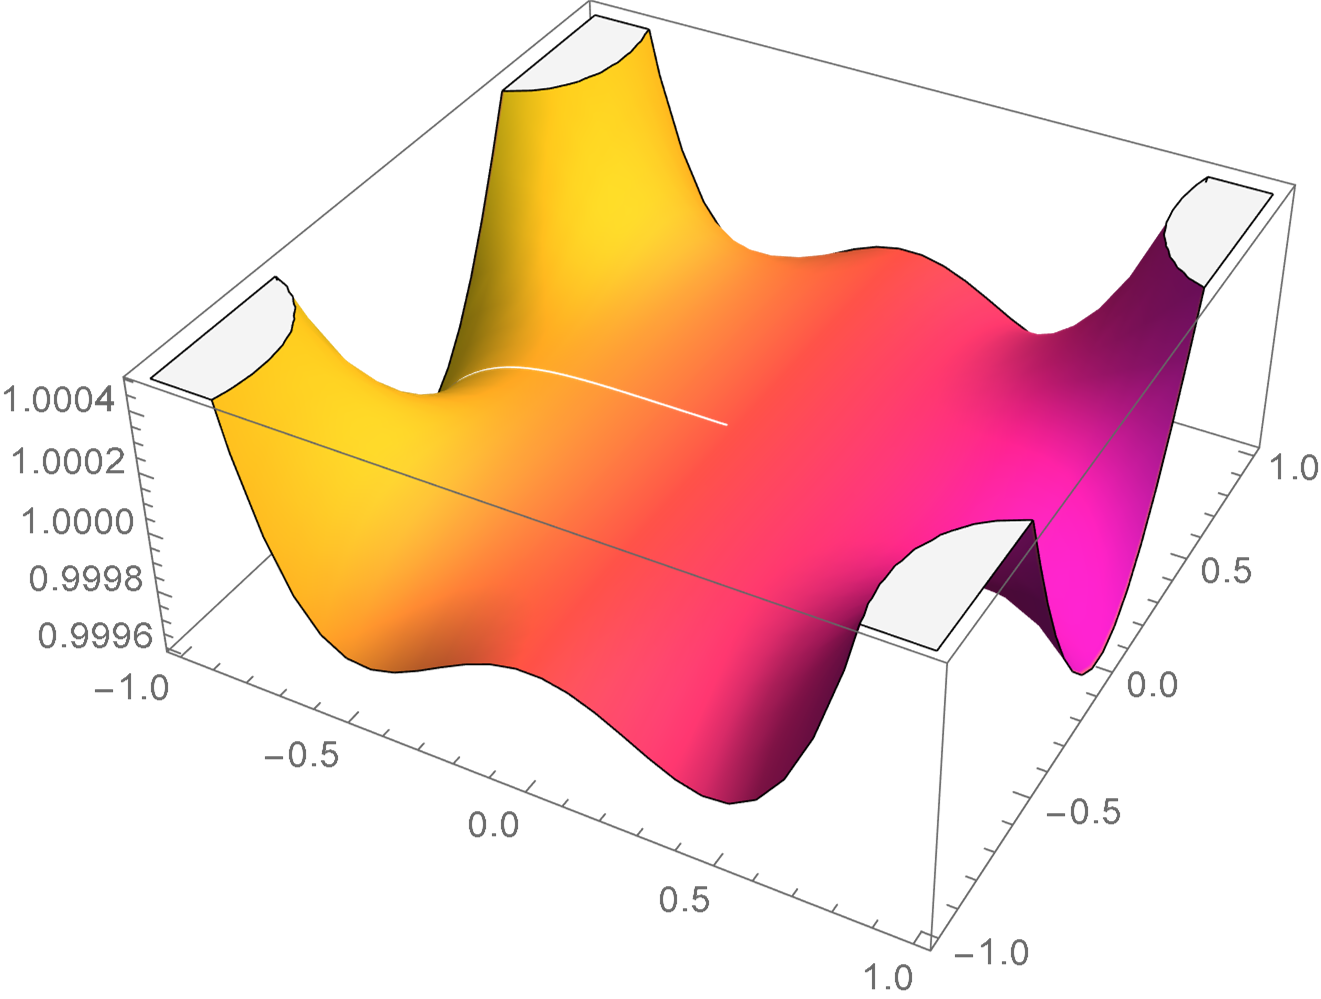
There are 2 functions that can help you: ComplexPlot,ComplexPlot3D. You can read about them here. I will provide you an example:
nf = 4; (*Final n*)
f1[r_, \[Phi]_] :=
  Sum[(BesselJ[n, r]*E^(I n \[Phi]))/I^n, {n, -nf, nf}];
(*Changing to singal variable representation *)
f2[z_] := f1[Abs[z], Arg[z]];
ComplexPlot[f2[z], {z, -1 - I, 1 + I}]
ComplexPlot3D[f2[z], {z, -1 - I, 1 + I}]
The output:


You can also read about the Manipulate option to write a code where you change nf with a dynamic slide. Generally, if you want to show several graphics combined you would use the Show function, but as you use the color of the graph to represent the phase, I would not advise doing so. Plot for every n separately.
Hope that helps


Sum[BesselJ[n, r] Sin[I* n *\[Phi]]/I^n, {n, -k, k}]performs0. $\endgroup$Nhas a built-in meaning and should not be used as a user-defined variable/constant.Sin[I n \[Phi]]is the proper syntax and spelling; however, the sum is zero so the plot won't be very interesting. $\endgroup$eshould beE(all built - in names start with a capital letter) . UsePlot3Dto plot against bothrandphifor a given number of terms. $\endgroup$Plot3DandPiare misspelled. There are syntax errors. You cannot plot a complex function withPlot3D, useAbsorArgof the function to obtain a real-valued function. The range ofrandphiappear to be interchanged. $\endgroup$