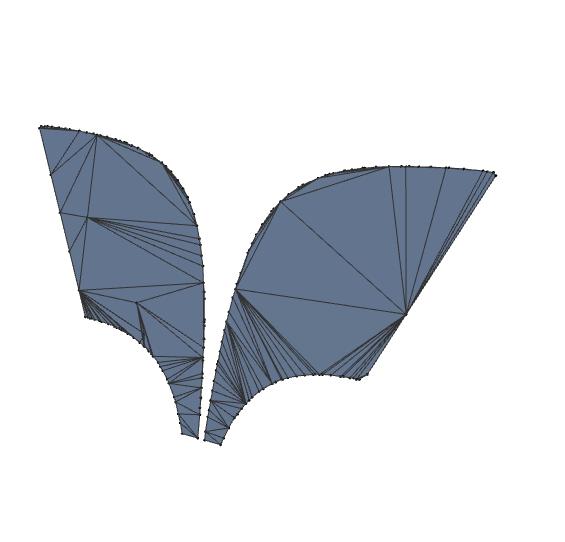
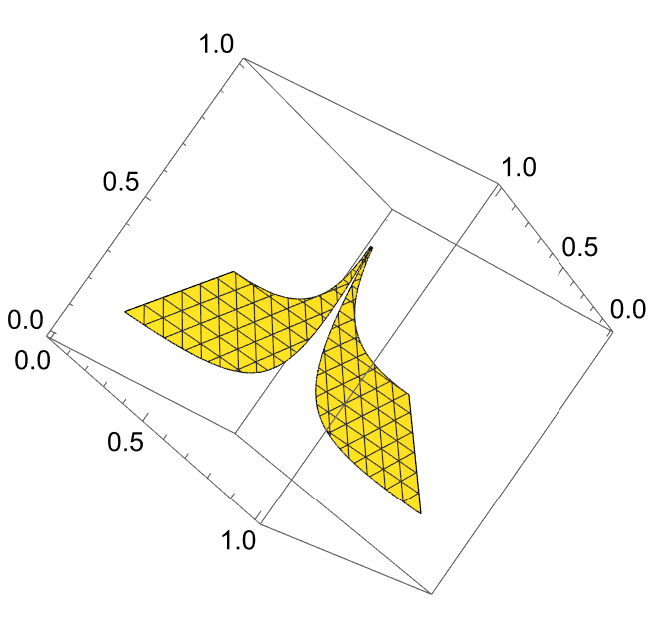
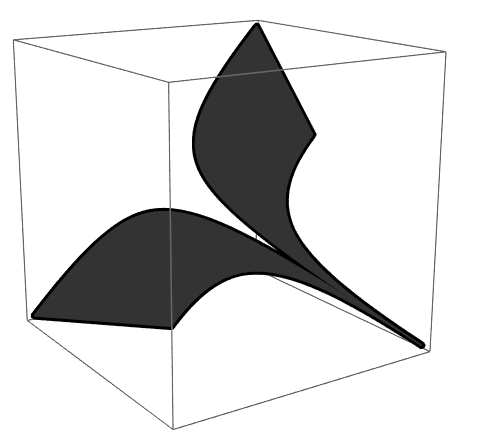
This code
DiscretizeRegion[
ImplicitRegion[y/(0.2*Max[x,z]) >= Max[x,z]/Abs[x-z] && y/(0.9*Max[x,z]) <= Max[x,z]/Abs[x-z] &&
x + y + z == 1, {{x, 0, 1}, {y, 0, 1}, {z, 0, 1}}],
 MaxCellMeasure -> {"Length" -> 0.01}, Method -> "ContourPlot3D", PlotTheme -> "DarkMesh"]
produces the graph below, whose lower tails are chopped.
Could it be refined somehow so that the full graph is shown?


