14
$\begingroup$

I have been having fun with:

g = Graphics[{AbsoluteThickness[5], 
   BezierCurve[RandomReal[1, {30, 2}]]}, ImageSize -> {800, 800}]

g = Graphics[{AbsoluteThickness[5], 
   BSplineCurve[RandomReal[1, {20, 2}]]}, ImageSize -> {800, 800}]

Can you think of any other Mathematica methods to expand our genre of doodles?

$\endgroup$
5
  • 1
    $\begingroup$ You may want to look at AnglePath. $\endgroup$
    – Tim Laska
    Commented Mar 3, 2021 at 18:08
  • 1
    $\begingroup$ @TimLaska as in Graphics[Line[AnglePath[N@Range[300000]]]] :-) $\endgroup$
    – chris
    Commented Mar 3, 2021 at 18:11
  • 3
    $\begingroup$ seen @AntonAntonov's resource function RandomScribble? $\endgroup$
    – kglr
    Commented Mar 3, 2021 at 18:15
  • 1
    $\begingroup$ you can also try Line + BSplineFunction/BezierFunction to get some flexibility in styling. For example, SeedRandom[7]; Graphics[{AbsoluteThickness[20], CapForm["Round"], JoinForm["Round"], Line[BSplineFunction[RandomReal[1, {20, 2}]] /@ Subdivide[300], VertexColors -> (Append[ColorData["Rainbow"]@#, .9] & /@ Subdivide[300])]}, ImageSize -> 500] $\endgroup$
    – kglr
    Commented Mar 3, 2021 at 20:22
  • 1
    $\begingroup$ Also might find some reasonable ideas from the Wolfram Function Repository random scribble function $\endgroup$ Commented Mar 5, 2021 at 14:32

8 Answers 8

18
$\begingroup$

I don't know if turtle graphics qualify as doodles, but here are some ideas. This turtle code is based on a reference that I can no longer find. Sorry.

RandomTurtle[recursion_List, axiom_String, depth_Integer, angle_,
   steplen_, posn_List : {0., 0.},
   dir_List : {1., 0.}, maxpts_Integer : 10, 
   maxpaths_Integer : 1] :=
 
   Module[{
      symbols, replacerules, turtle, tpos, tdir, 
      stack = {{N[posn], N[dir]}},
      path = Table[Null, {maxpaths}, {maxpts}], pathnum = 0, 
      npts = Table[1, {maxpaths}],
      rotateleft, rotateright, c = N[Cos[angle Degree]], 
      s = N[Sin[angle Degree]], k},

      symbols = {"F" -> forward, "B" -> back, "-" -> right,
         "+" -> left, "i" -> flip, "[" -> push, "]" -> pop};

      replacerules[r_List] := 
         Map[Characters[#[[1]]][[1]] -> Characters[#[[2]]] &, r] /. symbols;

      turtle[pop] := ({tpos, tdir} = First[stack]; 
      path[[++pathnum, 1]] = tpos;
      stack = Rest[stack]);
      turtle[push] := PrependTo[stack, {tpos, tdir}];
      turtle[left] := tdir = rotateleft . tdir;
      turtle[right] := tdir = rotateright . tdir;
      turtle[forward] := 
         path[[pathnum, ++npts[[pathnum]]]] = (tpos += steplen tdir);
      turtle[back] := 
         path[[pathnum, ++npts[[pathnum]]]] = (tpos -= steplen tdir);
      turtle[flip] := {rotateleft, rotateright} = {rotateright, rotateleft};
      Attributes[turtle] = Listable;

      rotateright = Transpose[rotateleft = {{c, -s}, {s, c}}];

      k = 0;
      turtle[Nest[
         (k = k + 1; # /. replacerules[{recursion[[k]]}]) &,
            Prepend[Characters[axiom] /. symbols, pop], depth]];

      path = Map[Take[path[[#]], npts[[#]]] &, Range[pathnum]]
   ]

Generate m random rules for the turtle.

RandomRuleGen[m_Integer] :=
   Map[
       "F" -> StringJoin[#] &,
       RandomChoice[{"F", "B", "-", "+", "i"}, {m, 20}] //.
   {{x___, "F", "B", z___} -> {x, z}, {x___, "B", "F", z___} -> {x, z},
    {x___, "+", "-", z___} -> {x, z}, {x___, "-", "+", z___} -> {x, z},
    {x___, "i", "i", z___} -> {x, z}}]

The following plots random graphics.

RandomTurtleGallery[m_Integer, n_Integer, order_] :=
   Block[{r = RandomRuleGen[m], RuleTuples, paths},
      RuleTuples = Tuples[r, {n}];
      Print[r];
      paths = Table[
         RandomTurtle[
            RuleTuples[[i]],
            StringJoin[Riffle[ConstantArray["F", order], "-"]], n, 360./order,
            1.0, {0., 0.}, {1., 0.}, 2^(3 n + 3) + 1, 1],
         {i, 1, Length[RuleTuples]}];
      GraphicsGrid[Partition[Map[Graphics[Line[#]] &, paths], UpTo[6]]]
 ]

Here are some examples with 7-fold symmetry.

RandomTurtleGallery[3, 4, 7]

{F->-B++BiB-Fi,F->Fi--B-i----i,F->Bi-FFFi++i}
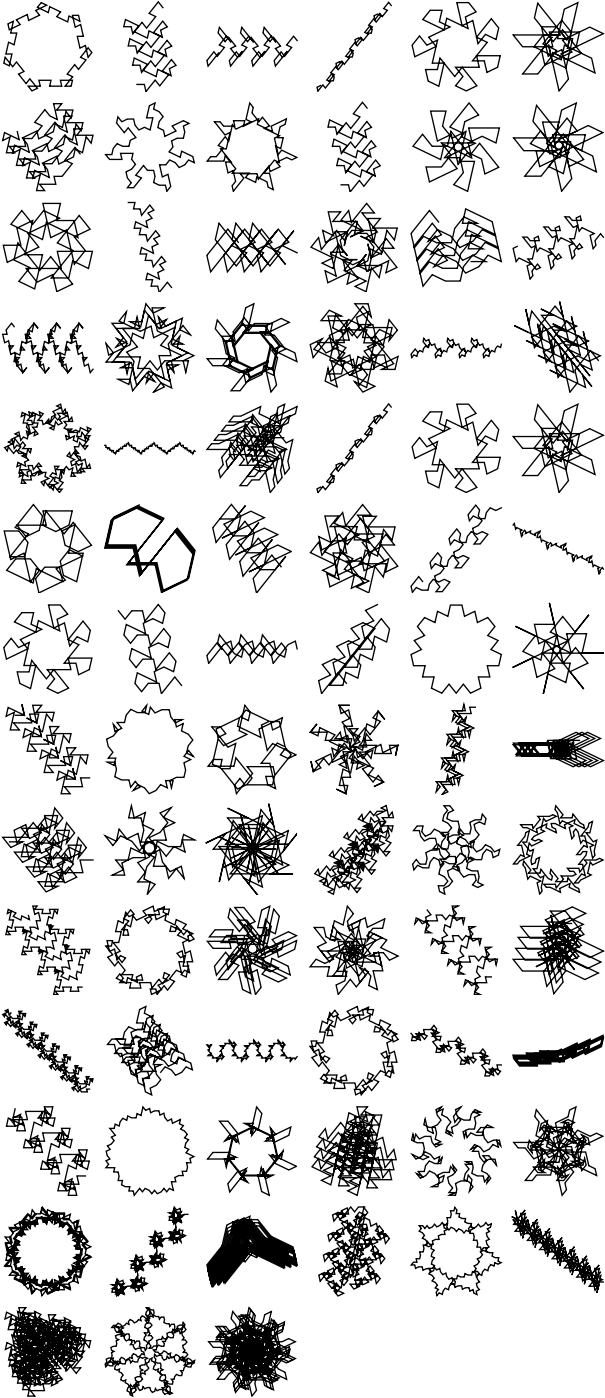
turtle graphics

$\endgroup$
1
  • 1
    $\begingroup$ Great answer! Please consider submitting a corresponding function to WFR. $\endgroup$ Commented Apr 18, 2022 at 12:25
7
$\begingroup$

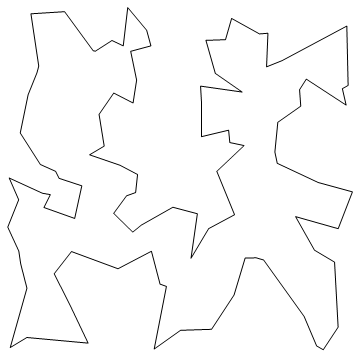
Try the following

pts = RandomReal[{-10, 10}, {100, 2}];
st = FindShortestTour[pts][[2]];
Graphics[Line[pts[[st]]]]

enter image description here

Help has variants. Have fun.

$\endgroup$
1
  • 1
    $\begingroup$ Or (minor edit) Graphics[{Darker[Red, 0.3], Polygon[pts[[st]]]}] $\endgroup$
    – chris
    Commented Mar 3, 2021 at 18:13
7
$\begingroup$

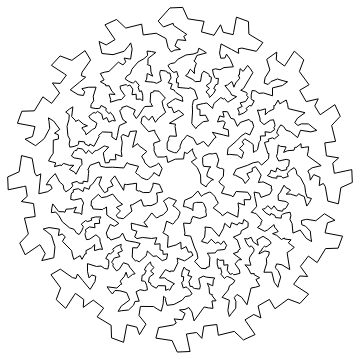
Extending the answer from @Hugh, you can add some symmetry to the set of points, and get an approximately symmetric doodle. For example:

pts = RandomReal[{-10, 10}, {100, 2}];
ptsn = 
 Block[{n = 16}, 
  Flatten[Table[RotationMatrix[2 π i/n] . # & /@ pts, {i, 1, n}], 
   1]];
stn = FindShortestTour[ptsn][[2]];
Graphics[Line[ptsn[[stn]]]]

enter image description here

$\endgroup$
6
$\begingroup$

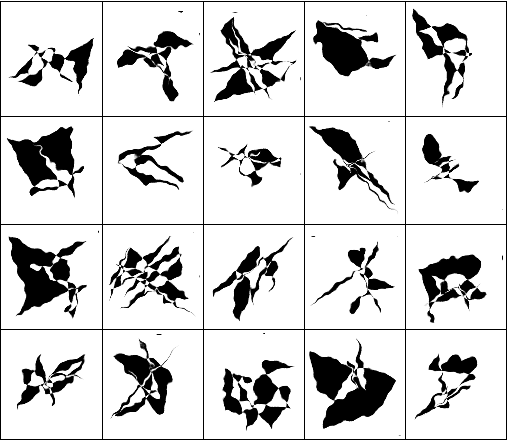
Some of the comments suggested the Wolfram Function Repository (WFR) function RandomScribble, which, combined with WFR's XKCDConvert can produce fairly doodle-like images. Here are examples:

SeedRandom[774];
AbsoluteTiming[
  lsDoodles = Table[ResourceFunction["RandomScribble"]["NumberOfStrokes" -> RandomInteger[{15, 20}], "OrderedStrokePoints" -> False, "ConnectingFunction" -> RandomChoice[{2, 6} -> {Polygon, FilledCurve@*BezierCurve}], ColorFunction -> None, ImageSize -> Small], 36]; 
 ]

(*{0.015869, Null}*)
AbsoluteTiming[
  Quiet[
   lsXKCDDoodles = ParallelMap[Quiet[ResourceFunction["XKCDConvert"][#, "Distortion" -> 4]] &, lsDoodles]; 
  ] 
 ]

(*{11.7042, Null}*)
lsXKCDDoodles2 = Select[lsXKCDDoodles, ImageQ];
Multicolumn[lsXKCDDoodles2, Dividers -> All]

enter image description here

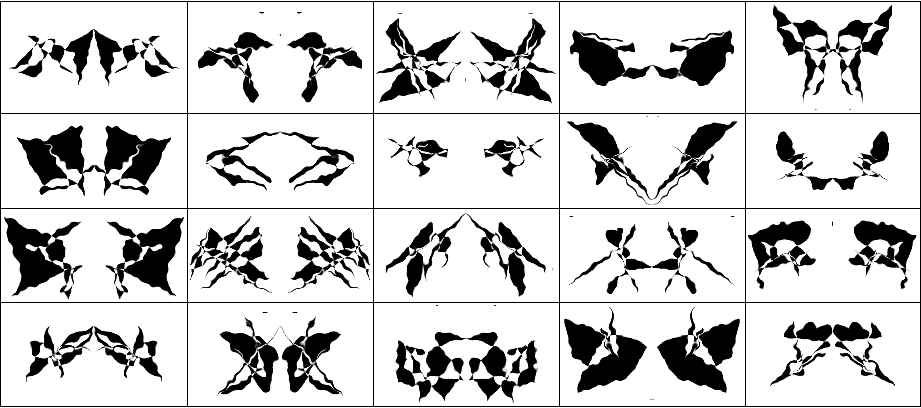
Attempts to Rorschach test effect:

lsXKCDDoodles3 = Map[ImageAssemble[{#, ImageReflect[#, Left -> Right]}] &, ImageCrop /@ lsXKCDDoodles2];
Multicolumn[lsXKCDDoodles3, Dividers -> All, Alignment -> Center]

enter image description here

$\endgroup$
3
  • 1
    $\begingroup$ Okay, nice...but what about doodles of poodles, using noodles? $\endgroup$ Commented Apr 22, 2022 at 19:14
  • $\begingroup$ @DanielLichtblau Sure, I will make some doodles like that. $\endgroup$ Commented Apr 22, 2022 at 19:58
  • $\begingroup$ I thought you might... $\endgroup$ Commented Apr 22, 2022 at 20:57
6
$\begingroup$

It will be no surprise to those who have seen my posts that Mathematica's built-in Noodle-Doodle-Solve[] is my go-to tool in such cases as this. Once at a Wolfram Tech Conference, we were snowed in. We passed the time telling stories about the old days. One of the old timers told me the story of the doodle solver.

Thirty years ago or so, we had a brilliant young developer who thought, you know, Mathematica should be FUN! As it turned out, they had been playing with the Livermore Scribbler of Ordinary Doodle Ensembles, and felt it would be a great way to showcase Mathematica's then-revolutionary Adaptive algorithms. However, their pleas for more fun fell on deaf ears. It is often the case that the inventor cannot see their brain-child for what it is. It takes someone with a fresh outlook to see in someone else's idea something that is quite boring but useful. To assuage hurt feelings, they kept the name. Thus NDSolve[] was born, and LSODA became its default algorithm.

However, one default setting was removed:

ordinaryDoodleSystem = {
   theta'[s] == doodle[s], theta[0] == theta0,
   x'[s] == Cos[theta[s]], x[0] == x0,
   y'[s] == Sin[theta[s]], y[0] == y0
   };

It would have been lost to time, except that the inventor scratched it into a bathroom stall at the WTC venue. It can almost be made out underneath several layers of paint, but some parts were obscured. Based on some accompanying text, some of which cannot be printed, I searched for the developer to fill in the missing code, traveling near and far. I finally found him high in the Andes. His interest in doodles had found expression in making quipu. He was kind enough to share the following. It is a testament to his prowess as a developer that his code still runs, unaltered, after so many years:

doodleMaker[doodle_, {s_, a_, b_}, theta0_ : 0, x0_ : 0, y0_ : 0] :=
    Module[{x, y, theta},
   ListLinePlot[Transpose@NDSolveValue[
      {theta'[s] == doodle, theta[a] == theta0,
       x'[s] == Cos[theta[s]], x[a] == x0,
       y'[s] == Sin[theta[s]], y[a] == y0
       },
      Through[{x, y}@"ValuesOnGrid"], {s, a, b}],
    PlotRange -> All,
    InterpolationOrder -> 3]
   ];

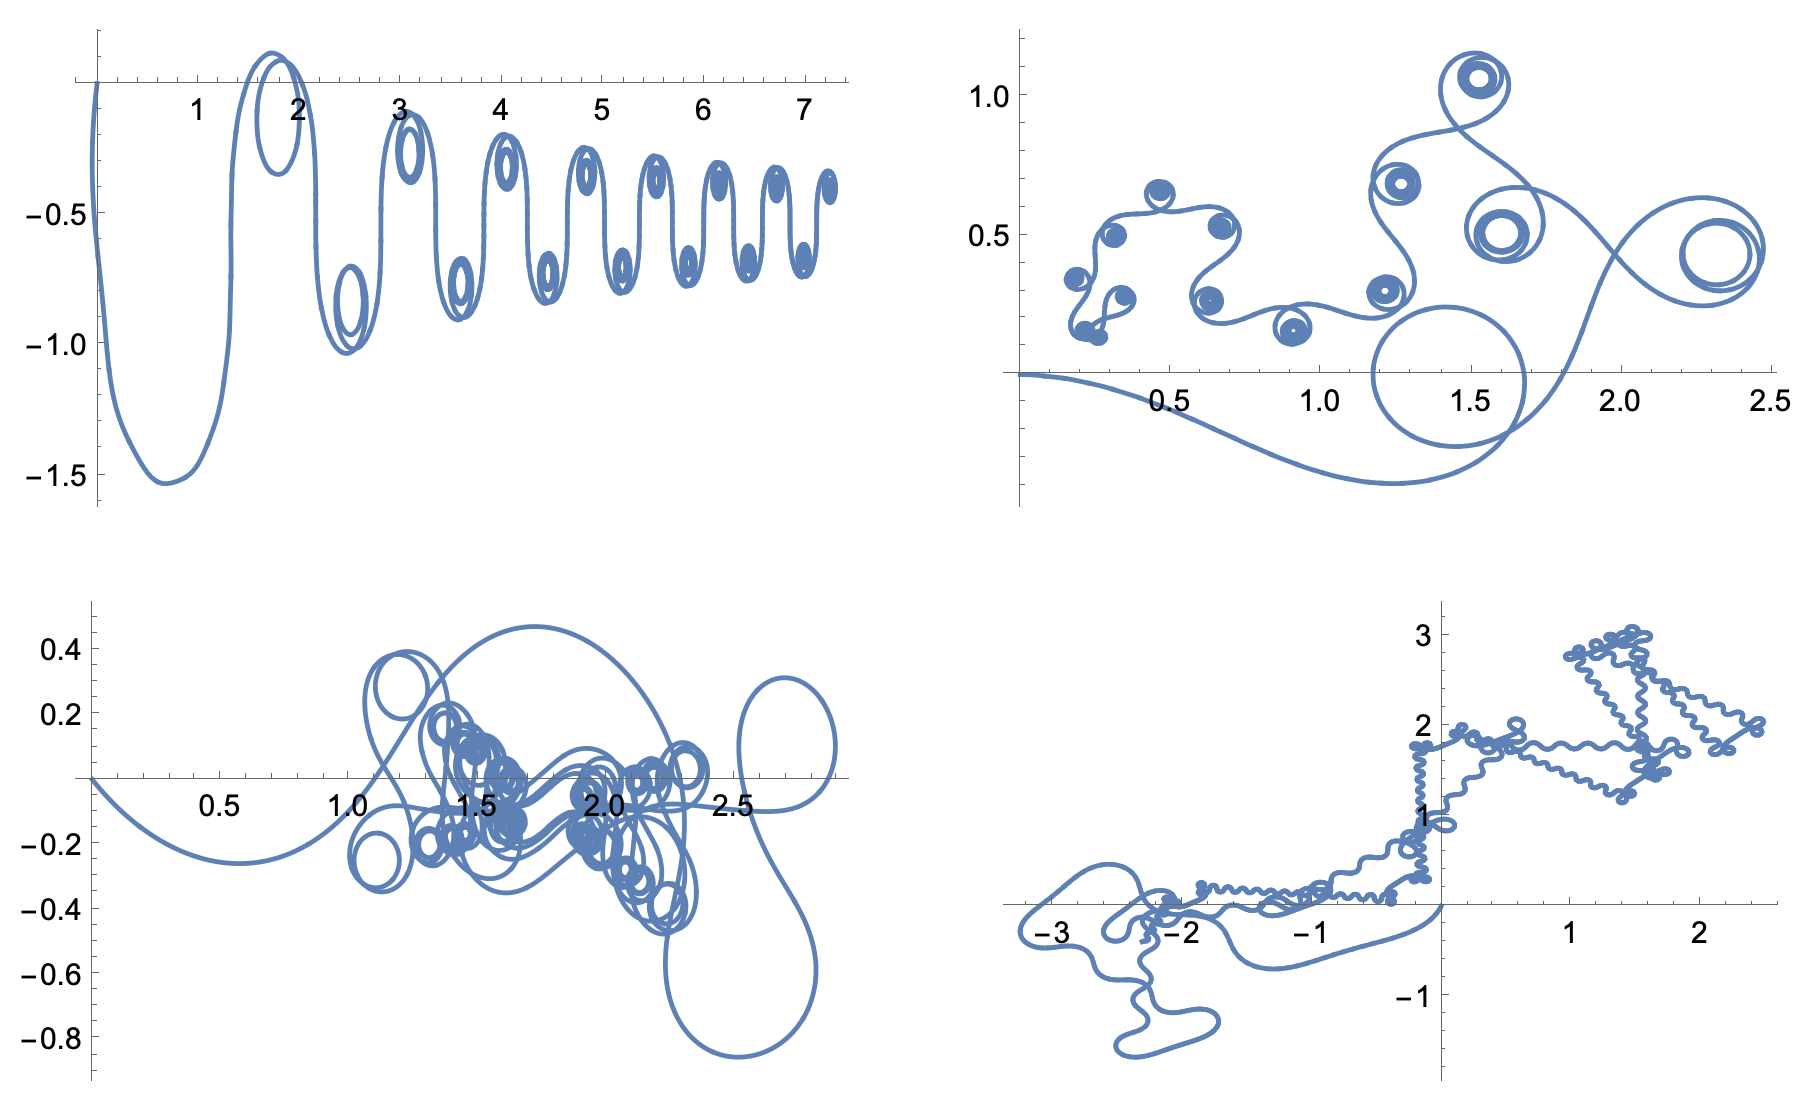
Here are some examples I created:

GraphicsGrid@{
  {doodleMaker[s Sin[s] + Cos[4 s^2], {s, 0, 50}, -3 Pi/5], 
   doodleMaker[s^2 Cos[s]/10 + Cos[6 s^2], {s, 4, 50}]},
  {doodleMaker[s Sin[2 s] + Cos[s^2], {s, 0, 50}, -Pi/4], 
   doodleMaker[
    s^2 Cos[Sin[s] s]/(4 + s) + Cos[6 s^2], {s, 4, 50}, -3 Pi/5]}}

enter image description here

$\endgroup$
3
  • 2
    $\begingroup$ You're having waaay too much fun this afternoon. $\endgroup$ Commented Apr 22, 2022 at 22:25
  • 1
    $\begingroup$ It should perhaps be noted that the code here effectively plots a curve whose Cesàro equation is the function represented by doodle. $\endgroup$ Commented May 17, 2022 at 18:53
  • $\begingroup$ Or use the ResourceFunction["CurvaturePlot"] function to do this… $\endgroup$
    – SHuisman
    Commented Dec 8, 2023 at 20:39
4
$\begingroup$

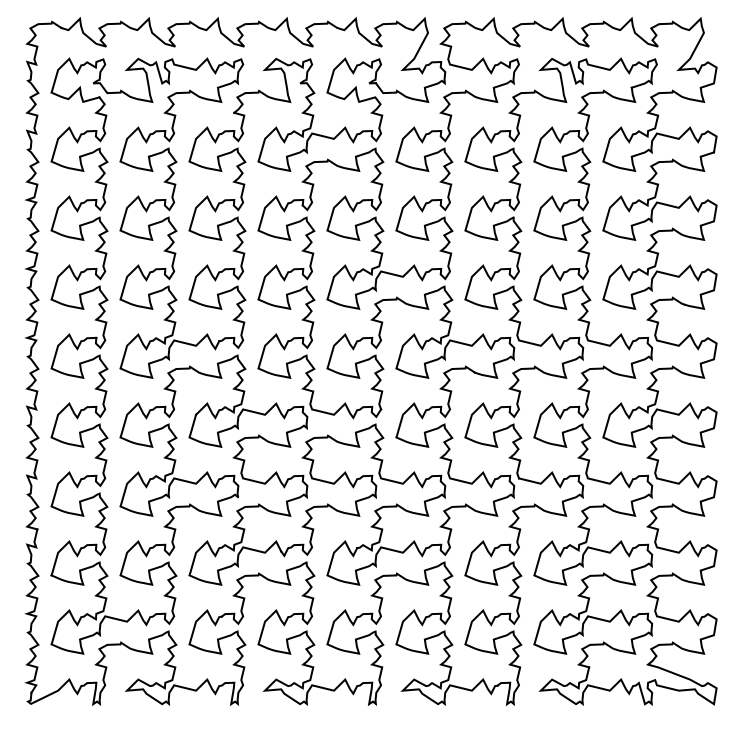
We can also copy the points using any of the Wallpaper groups. Below I use the p1 group which is the simplest of the groups.

pnts=Flatten[Outer[Plus,Tuples[Range@10,2],RandomReal[{-0.5,0.5},{30,2}],1],1];
tour=Last@FindShortestTour@pnts;
Graphics@{Line@pnts[[tour]]}

enter image description here

$\endgroup$
1
  • $\begingroup$ Very nice, thanks for sharing! $\endgroup$ Commented Apr 23, 2022 at 8:10
3
$\begingroup$

1. Doodle

My Doodle is similar to Michaels's solution and an adaption of Alfred Gray's "intrinsic function" (Alfred Gray, Modern differential geometry of curves and surfaces with Mathematica, 3rd ed., Boca Raton 2006, p 140 ff)

Doodle[f_, a_, r_][t_] :=
 Module[{x, y, p, s, sol},
  sol =
   {x'[s] == Cos[p @ s], y'[s] == Sin[p @ s], p'[s] == f[s],
    x[0] == 0, y[0] == 0, p[0] == a};
  sol = NDSolve[sol, {x, y, p}, {s, -r, r}];
  {x[t], y[t]} /. sol[[1]]]

It is very sensitive to small parameter changes.

n = 30;
ParametricPlot[
 Evaluate[Doodle[# Sin[0.24 #] &, 0, n][t]], {t, -n, n},
 Axes -> False,
 Background -> Black,
 ColorFunction -> "RedBlueTones",
 PlotPoints -> 100,
 PlotRange -> All,
 PlotStyle -> Thickness[0.004]]

enter image description here

2. AnglePath

Graphics[{
  GrayLevel[0.8],
  Thickness[0.004],
  Line[AnglePath[Range[5, 27, .01]]]},
 Axes -> False,
 Background -> Darker @ Red]

enter image description here

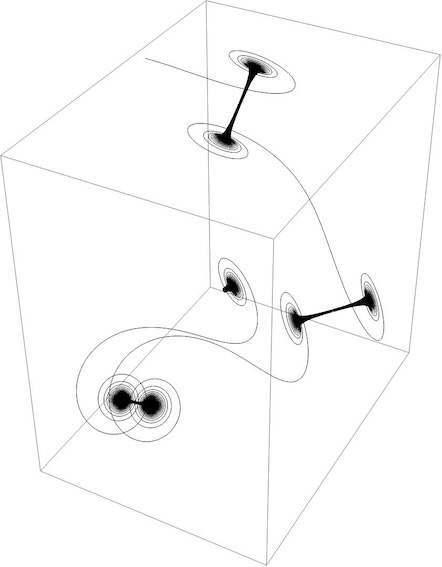
3. AnglePath3D

From its documentation:

a = Range[0, 20, .001];
b = ConstantArray[0.01, Length[a]];

Graphics3D[Line @ AnglePath3D[Transpose[{a, b}]]]

enter image description here

4. ListCurvePathPlot

Table[
  ListCurvePathPlot[RandomReal[{0, 5}, {5, 5}],
    AspectRatio -> 1,
    Frame -> False,
    GridLines -> None,
    ImageSize -> 100,
    PlotStyle -> White,
    PlotTheme -> "Marketing"] /. Line :> BSplineCurve,
  4] // Row

enter image description here

$\endgroup$
1
$\begingroup$

@MarcoB, @Tim Laska, @kglr, @Daniel Lichtblau, @KennyColnago - Thank you all for your help. I am still working through the problem and have progressed no further than Besier functions. Here's my current code:

(* delete ani.gif before running*)
(* after ani.gif is exported, use \
https://logosbynick.com/create-animated-gifs
-with-gimp/ with canvas \
at 1900 x 1900 and 990 ms per frame, 
maximum f = 60 for GIMP *)

f = 100; (*frames; animation starts 
skipping above 5 frames, but \
exported gif is ok up to ~ 45 frames 
for ImageSize\[Rule]{500,500}*)

For[i = 1, i <= f, i++,
 t[i] = RandomReal[{0, 1}, {20, 2}]]; 
(*number of random points*)


For[i = 1, i <= f, i++,
 g[i] = Graphics[{AbsoluteThickness[2], 
     BezierCurve[t[i], SplineClosed -> True, 
      SplineDegree -> RandomInteger[{4, 16}]]}, 
PlotRange -> {0, 1}, 
    ImageSize -> {500, 500}];];

For[i = 1, i <= f, i++, Print[i];
  lab[i] = MorphologicalComponents[g[i]]; 
Print[Colorize[lab[i]]]];

For[i = 1, i <= f, i++,
  col[i] = Colorize[lab[i]]];

ani = Animate[col[i], {i, 1, f, 1}, 
  DisplayAllSteps -> True];  (*Not too good*)

Export["ani100.gif", ani]

As you can imagine, Animate doesn't work well on so much data. So, I am reading ani into GIMP layers and producing an animated gif there. Even with GIMP, I am maxing out at 45 layers. I don't think many of the options for Animate actual work. I would upload the image here, but it is too large for the forum.

Please continue with any ideas for diverse doodles.

$\endgroup$
0

Your Answer

By clicking “Post Your Answer”, you agree to our terms of service and acknowledge you have read our privacy policy.

Not the answer you're looking for? Browse other questions tagged or ask your own question.