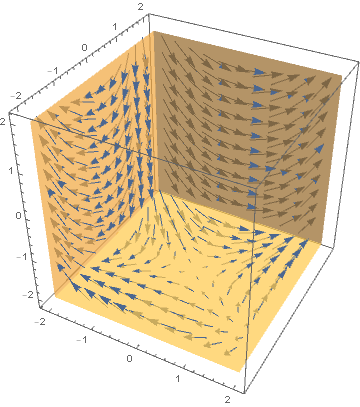
I have the following vector functions:
$$E=\left\langle \cos\left[\frac{\pi x}{5}\right]\sin\left[\frac{\pi y}{4}\right], \sin\left[\frac{\pi x}{5}\right]\cos\left[\frac{\pi y}{4}\right], \sin\left[\frac{\pi x}{5}\right] \sin\left[\frac{\pi y}{4}\right] \right\rangle$$
$$B=\left\langle -\sin\left[\frac{\pi x}{5}\right]\cos\left[\frac{\pi y}{4}\right], \cos\left[\frac{\pi x}{5}\right]\sin\left[\frac{\pi y}{4}\right],0 \right\rangle$$
And I'd like to graph each of these in a different plane, so I want to know what they look like in the $xy$, $xz$, and $yz$ planes. Using stream plot I got a graph of the view in the $xy$ plane that I was happy with but with the other perspectives I'm finding them difficult to plot and I think it's because I have to use $x$ and $y$ bounds for StreamPlot. So, I'm wondering if there is a way to graph these vector fields in the $xz$ and $yz$ plots so that I have functions that aren't varying with respect to the $z$ axis? Because, for example, right now what I'm doing is just replacing the $x$ component with the $z$ component and graphing but since my $z$ component is in terms of $x$ it changes with the bounds which I don't want it to do.


e = {Cos[\[Pi] x/5] Sin[\[Pi] y/4], Sin[\[Pi] x/5] Cos[\[Pi] y/4], Sin[\[Pi] x/5] Sin[\[Pi] y/ 4]}; SliceVectorPlot3D[e, "BackPlanes", {x, -2, 2}, {y, -2, 2}, {z, -2, 2}]give what you need? $\endgroup$