SeedRandom[1]

xy = RandomSample[Tuples[Range[0, 10], 2], 10];

z = RandomReal[1, 10];

xyz = Join[xy, List /@ z, 2]
{{9, 5, 0.941699}, {7, 3, 0.294264}, {1, 3, 0.188274}, {0, 0, 0.761529},
 {6, 1, 0.169824}, {0, 3, 0.455359}, {5, 10, 0.75425}, {9, 1, 0.268291},
 {2, 1, 0.147377}, {8, 9, 0.480659}}
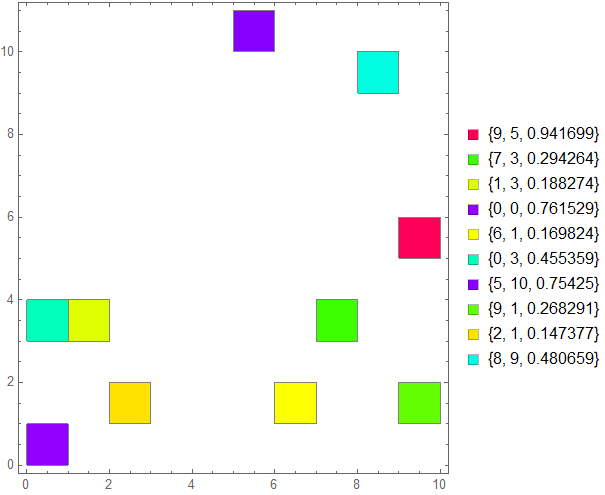
Graphics
graphics = Graphics[{EdgeForm[Gray], Hue @ #3, Rectangle[{#, #2}]} & @@@ xyz,
 Frame -> True];

legend = SwatchLegend[Hue /@ xyz[[All, -1]], Defer /@ xyz];

Legended[graphics, legend]
BubbleChart
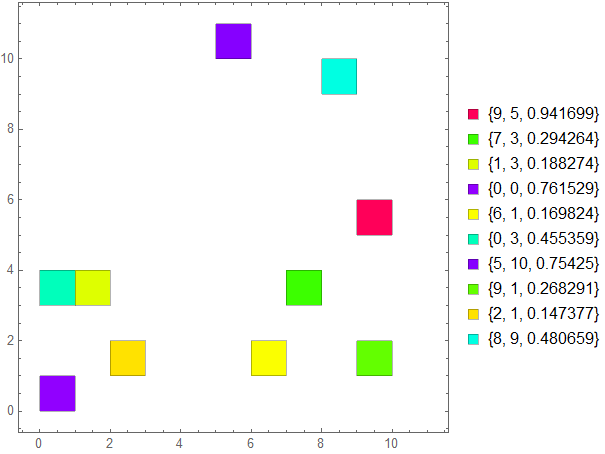
BubbleChart[xyz, ChartStyle -> (Hue /@ xyz[[All, -1]]),
 ChartElementFunction -> (Rectangle[Mean /@ #] &),
 PlotRange -> {{0, 11}, {0, 11}},
 ChartLegends -> {Defer /@ xyz}]
DensityHistogram
DensityHistogram[WeightedData[xyz[[All, ;; 2]], xyz[[All, -1]]], {1},
 ColorFunction -> Hue, BaseStyle -> EdgeForm[Gray],
 ChartElementFunction -> (Rectangle[Mean /@ #] &),
 ColorFunctionScaling -> False,
 ChartLegends -> SwatchLegend[Hue /@ xyz[[All, -1]], Defer /@ xyz]]
ListPlot
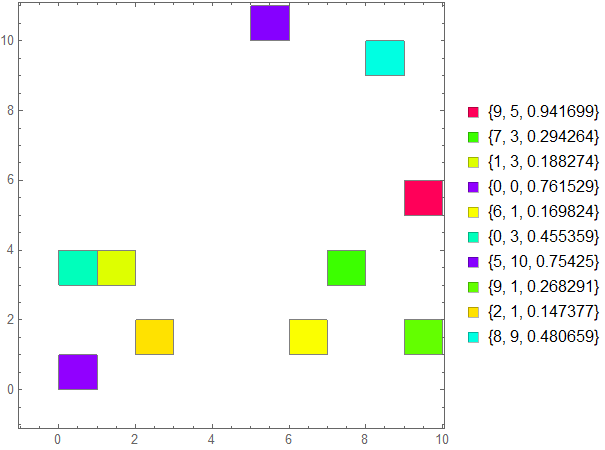
Legended[ReplaceAll[Point -> (Rectangle@*First)]@
  ListPlot[List /@ xyz[[All, ;; 2]],
   PlotStyle -> Hue /@ xyz[[All, -1]], BaseStyle -> EdgeForm[Gray],
   AspectRatio -> 1, Frame -> True, PlotRange -> {{0, 10}, {0, 11}},
   PlotRangePadding -> .2], legend]
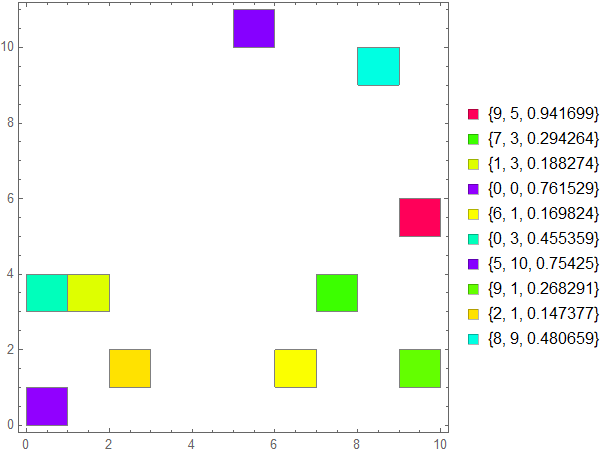
ArrayPlot
ArrayPlot[SparseArray[1 + {#2, #} -> Hue @ #3 & @@@ xyz],
 DataReversed -> True,
 FrameTicks -> Table[{# + 1/2, #} & /@ Range[0, 10], 4],
 PlotLegends -> legend]
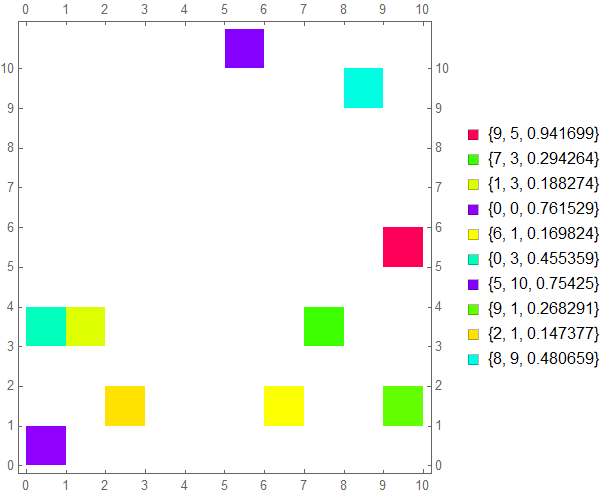
Update
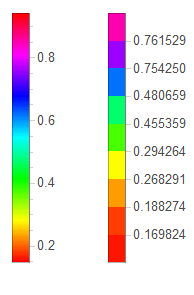
To have "the plot legend to look something like the likes of DensityPlot/ArrayPlot", replace legend above with barlegend1 or barlegend2, where
barlegend1 = BarLegend[{Hue, MinMax@xyz[[All, -1]]}];

barlegend2 = BarLegend[{Hue, MinMax@xyz[[All, -1]]}, xyz[[All, -1]]];

Row[{barlegend1, barlegend2}, Spacer[20]]
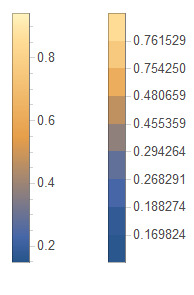
Replace Hue with ColorData["M10DefaultDensityGradient"] to use the default color scheme for DensityPlot:
barlegend1 = BarLegend[{"M10DefaultDensityGradient", MinMax@xyz[[All, -1]]}];
barlegend2 = BarLegend[{"M10DefaultDensityGradient", MinMax@xyz[[All, -1]]},
   xyz[[All, -1]]];

Row[{barlegend1, barlegend2}, Spacer[20]]
Legended[Graphics[{EdgeForm[Gray], Opacity[1],
   ColorData["M10DefaultDensityGradient"] @ #3, Rectangle[{#, #2}]} & @@@ xyz,
   Frame -> True],
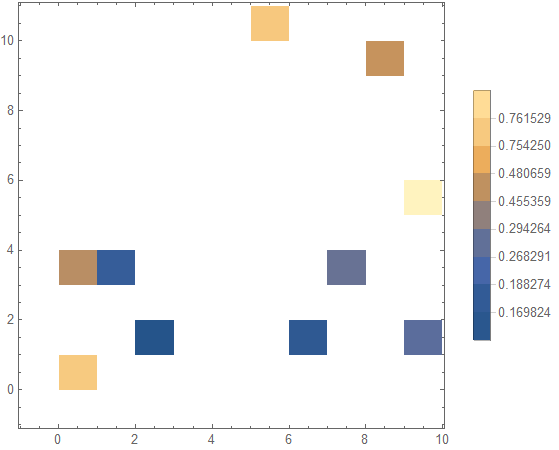
  barlegend2]
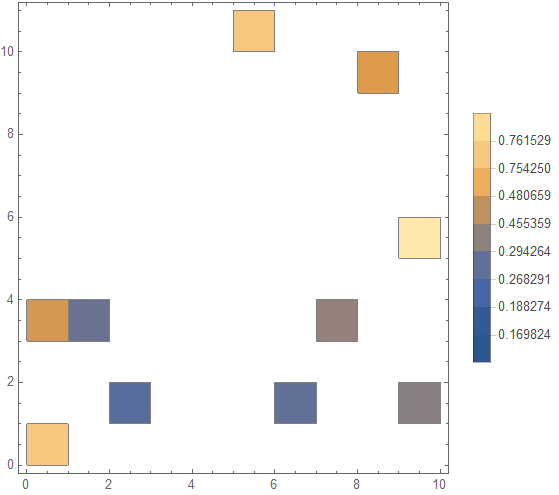
BubbleChart[xyz,
 ChartStyle -> (ColorData["M10DefaultDensityGradient"] /@ xyz[[All, -1]]),
 ChartElementFunction -> (Rectangle[Mean /@ #] &),
 PlotRange -> {{0, 11}, {0, 11}}, ChartLegends -> barlegend2]
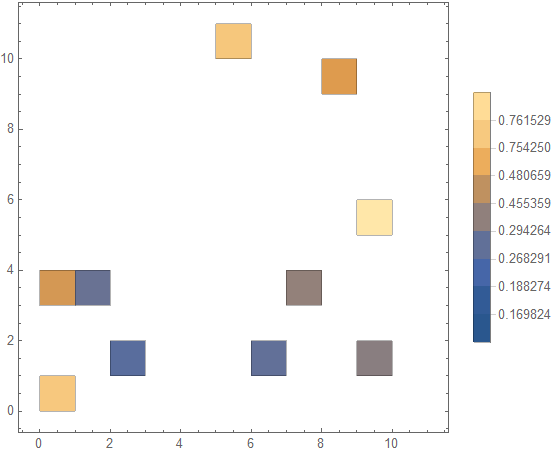
For DensityHistogram, just remove the option ColorFunction -> Hue:
DensityHistogram[WeightedData[xyz[[All, ;; 2]], xyz[[All, -1]]], {1},
 ChartElementFunction -> (Rectangle[Mean /@ #] &),
 ChartLegends -> BarLegend[Automatic, xyz[[All, -1]]]]
