1
$\begingroup$

I am making a Manipulate graphic that involves two points rotating on a circle with their trajectories being traced in two separate colors. Everything works fine until each point makes half a rotation, after which the color of the trajectory of the first point overwrites the overlapping trajectory of the second, but not vice versa. I am looking for a way to make it such that when blue catches up to the tail of red it begins to write over in blue and when red catches up to the tail of blue it begins to write over in red without simply hardcoding in ranges (in case I want to add more points in different spots). Ideally, I will be saving these as animations at some point.

Here is my code:

Manipulate[
 Show[ParametricPlot[{{-Cos[x], -Sin[x]}, {Cos[x], Sin[x]}}, {x, 0, 
    a}, PlotRange -> {{-1.05, 1.05}, {-1.05, 1.05}}, 
   PlotStyle -> {Red, Blue}, Ticks -> False], 
  ListPolarPlot[{{a, 1}}, PlotRange -> All, 
   PlotStyle -> PointSize[.05]], 
  ListPolarPlot[{{Pi + a, 1}}, PlotRange -> All, 
   PlotStyle -> {PointSize[.05], Red}]], {a, 0.01, 2*Pi}]
$\endgroup$
3
  • $\begingroup$ The points are not overwriting any lines. Two parametric plots (i.e. two arcs) are drawn for each value of a. The red arc is drawn first, then the blue one is drawn. When the arcs get larger than Pi, the two arcs overlap. Since the blue one is drawn last it overwrites the red one. $\endgroup$ Feb 6, 2021 at 1:08
  • $\begingroup$ I assumed that was the case. Is there any way to prevent that? $\endgroup$
    – Ztan
    Feb 6, 2021 at 1:26
  • $\begingroup$ Offset the tracks by changing the argument of the ParametricPlot to {0.993 {-Cos[x], -Sin[x]}, 1.007 {Cos[x], Sin[x]}} $\endgroup$
    – Bob Hanlon
    Feb 6, 2021 at 2:52

1 Answer 1

3
$\begingroup$

This probably counts as hardcoding ranges, but it works:

Manipulate[
 Show[ParametricPlot[{{-Cos[x], -Sin[x]}, {Cos[x], Sin[x]}}, {x, 
    Max[{0, a - Pi}], a}, PlotRange -> {{-1.05, 1.05}, {-1.05, 1.05}},
    PlotStyle -> {Red, Blue}, Ticks -> False], 
  ListPolarPlot[{{a, 1}}, PlotRange -> All, 
   PlotStyle -> PointSize[.05]], 
  ListPolarPlot[{{Pi + a, 1}}, PlotRange -> All, 
   PlotStyle -> {PointSize[.05], Red}]], {a, 0.01, 2*Pi}]
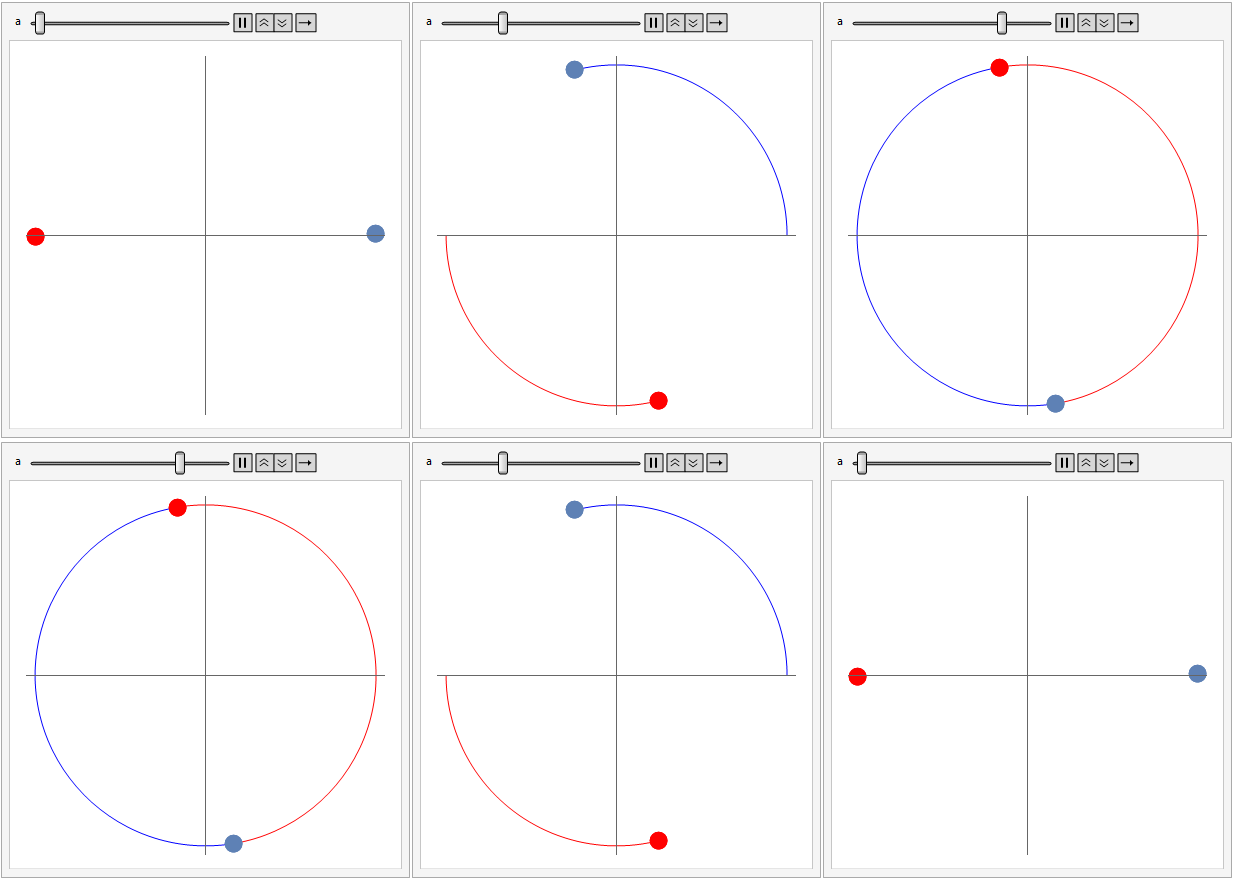
enter image description here

$\endgroup$

Your Answer

By clicking “Post Your Answer”, you agree to our terms of service and acknowledge that you have read and understand our privacy policy and code of conduct.

Not the answer you're looking for? Browse other questions tagged or ask your own question.