0
$\begingroup$

I use the following code to generate images of Julia sets:

JuliaSetPlot[
   z^2 - 0.76 - 0.11 I, z, 
   PlotRange -> {{-1.6, 1.6}, {-1.0, 1.0}}, 
   MaxIterations -> 1000, 
   ImageResolution -> 1500
]

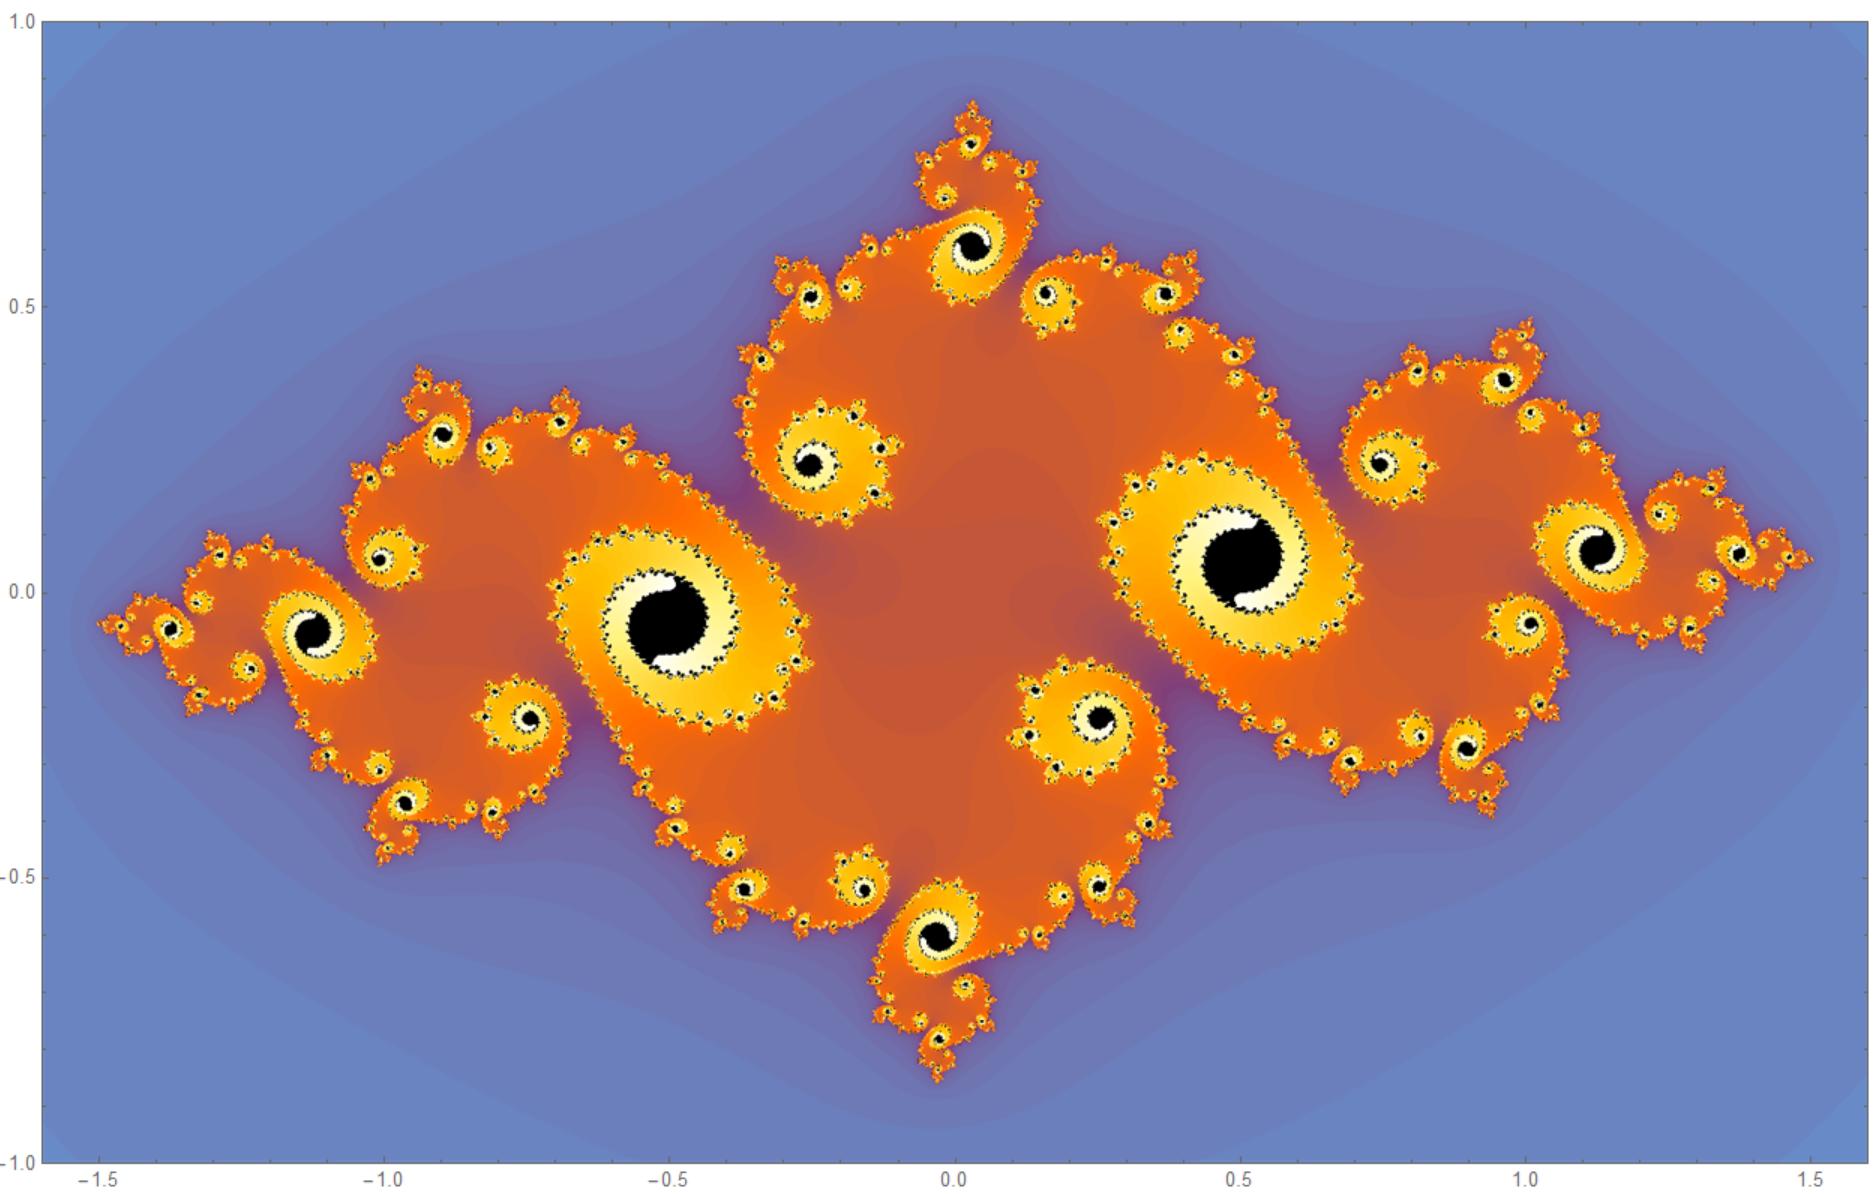
enter image description here

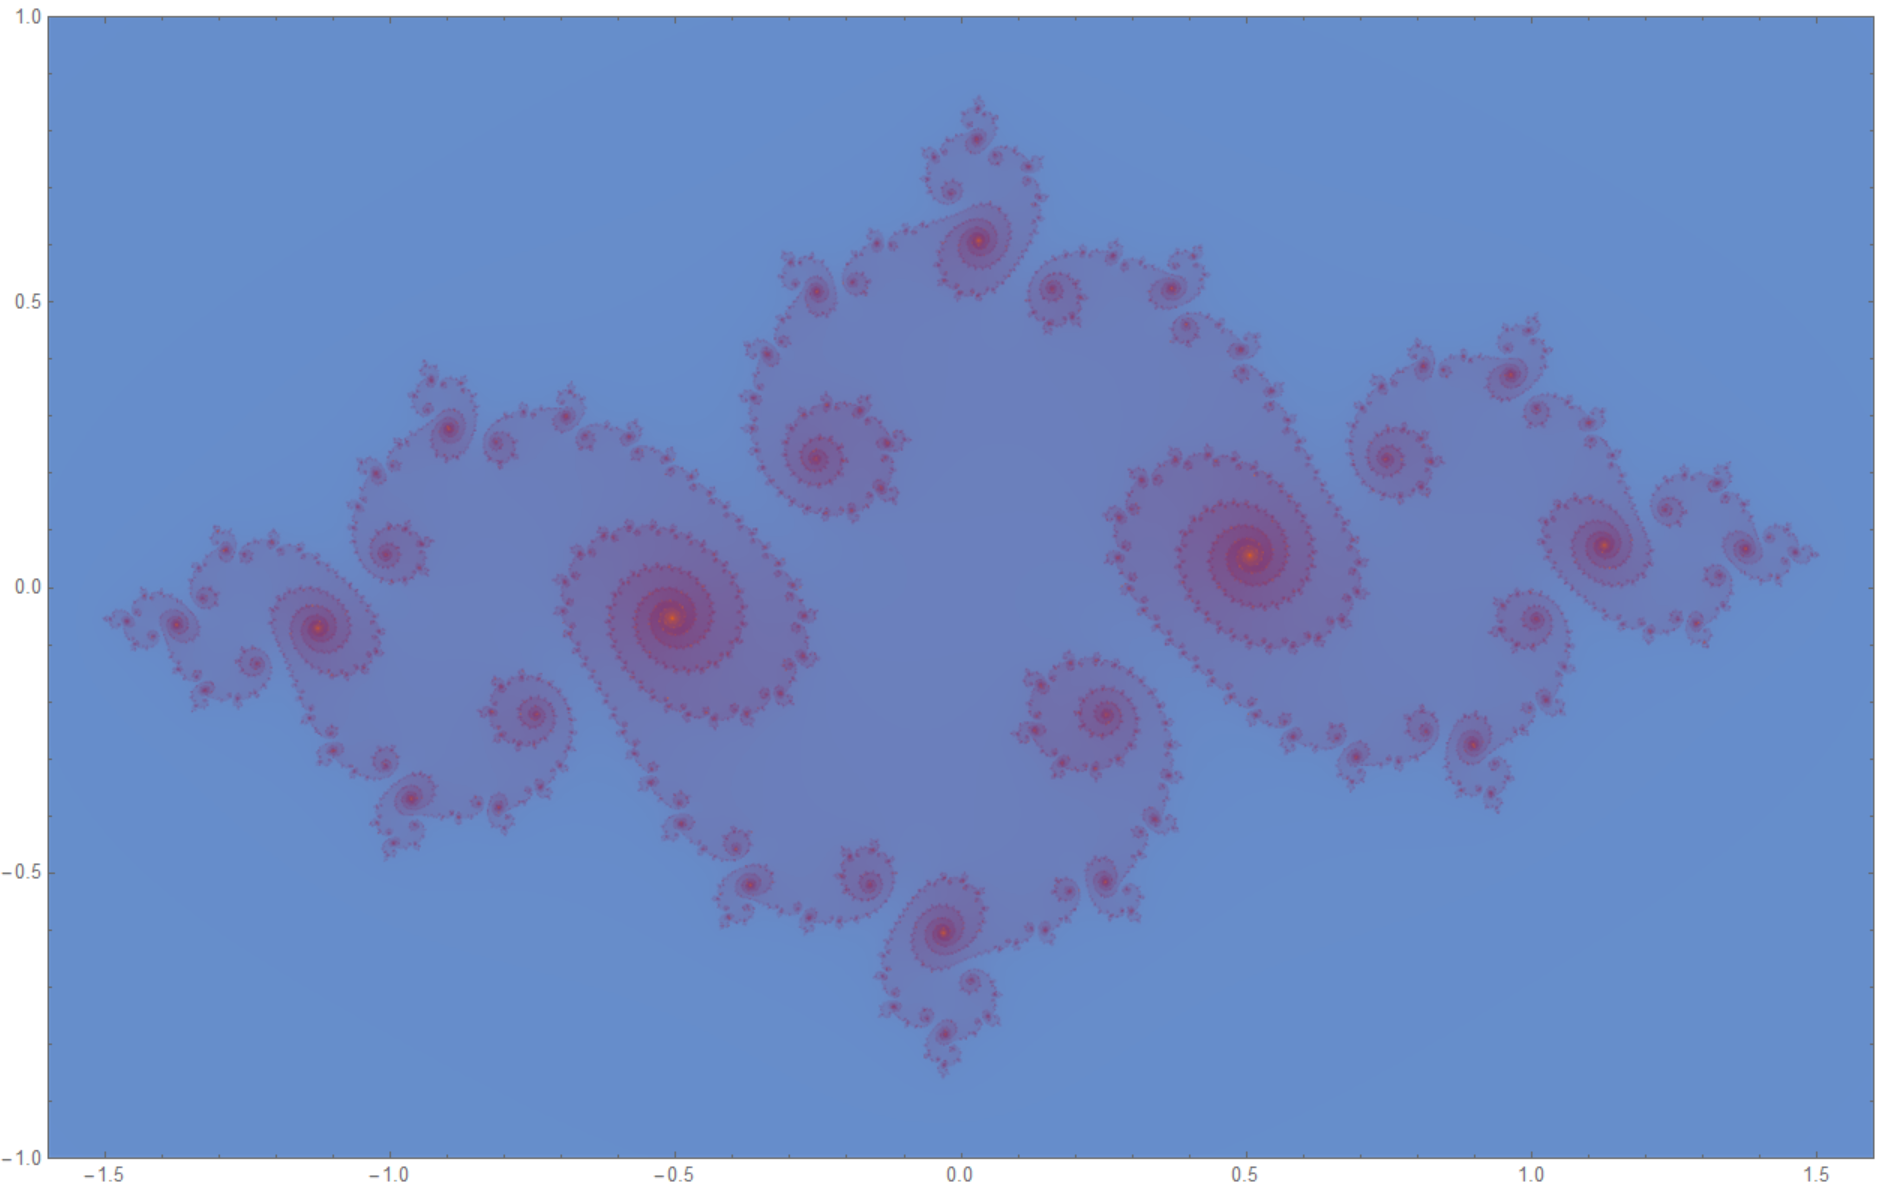
As you can see the colors are not too appealing. However I did code Julia sets in C# before and I know that the colors depend on the number of iterations so I tried less iterations:

enter image description here

This is what MaxIterations -> 100 gives me. I much prefer these colors. How can I get nicer colors while keeping a high number of iterations? I think ColorFunction or ColorFunctionScaling could get handy here but I never touched those so some help would be appreciated.

$\endgroup$

1 Answer 1

8
$\begingroup$

You can scale the values supplied

JuliaSetPlot[z^2 - 0.76 - 0.11 I, z, PlotRange -> {{-1.6, 1.6}, {-1.0, 1.0}}, 
 MaxIterations -> 1000, ImageResolution -> 1500,
 ColorFunction ->
  With[{cf = ColorData["M10DefaultFractalGradient"]},
   cf@Sqrt[#3] &
   ]
 ]

enter image description here

$\endgroup$

Your Answer

By clicking “Post Your Answer”, you agree to our terms of service and acknowledge you have read our privacy policy.

Not the answer you're looking for? Browse other questions tagged or ask your own question.