10
$\begingroup$

I have the following dataset:

Dataset[
 <|1 -> <|"High School" -> 96, "Graduate" -> 138, "Uneducated" -> 58, 
"College" -> 53, "Unknown" -> 75, "Post-Graduate" -> 41, 
"Doctorate" -> 1|>, 
2 -> <|"Uneducated" -> 185, "Graduate" -> 382, "College" -> 130, 
 "High School" -> 265, "Unknown" -> 163, "Post-Graduate" -> 59, 
 "Doctorate" -> 57|>, 
3 -> <|"High School" -> 481, "Uneducated" -> 366, "Graduate" -> 784, 
"Unknown" -> 374, "Post-Graduate" -> 118, "College" -> 251, 
"Doctorate" -> 98|>, 
 4 -> <|"High School" -> 540, "Graduate" -> 866, 
"Post-Graduate" -> 161, "Doctorate" -> 152, "Unknown" -> 454, 
"College" -> 268, "Uneducated" -> 433|>, 
5 -> <|"Graduate" -> 628, "Unknown" -> 293, "College" -> 224, 
"Uneducated" -> 278, "Doctorate" -> 93, "High School" -> 402, 
"Post-Graduate" -> 91|>, 
6 -> <|"Graduate" -> 256, "High School" -> 181, "Doctorate" -> 39, 
"College" -> 67, "Unknown" -> 123, "Uneducated" -> 140, 
"Post-Graduate" -> 44|>, 
7 -> <|"Unknown" -> 37, "Doctorate" -> 11, "High School" -> 46, 
"Graduate" -> 74, "College" -> 20, "Uneducated" -> 27, 
"Post-Graduate" -> 2|>, 8 -> <|"High School" -> 2|>|>
]

According to my understanding of the Dataset documentation, this should be displayed as a table where the numerical categories are the rows and the educational categories the columns. Instead it's displayed as a hierarchical data (rows of rows). Why is that?

$\endgroup$

1 Answer 1

13
$\begingroup$

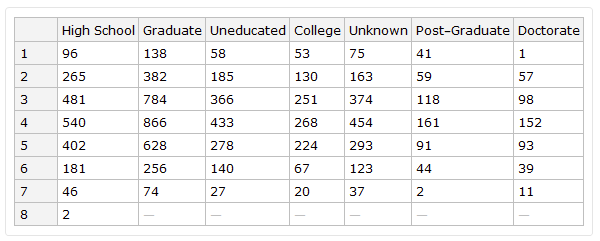
To obtain a tabular rendering for a dataset, all rows must have the same number of columns, with the same set of keys, in the same order. But in our case the last association has fewer elements than the rest and the keys are in different orders in each row. Assuming that $ds contains the dataset:

$ds[Values /* (PadRight[#, Automatic, ""] &), Keys]

enter image description here

To get a tabular rendering, we must normalize the key order and fill in the blanks in that last row. KeyUnion will do this:

$ds[Keys[#] -> KeyUnion[Values[#]] & /* AssociationThread]

resultant table

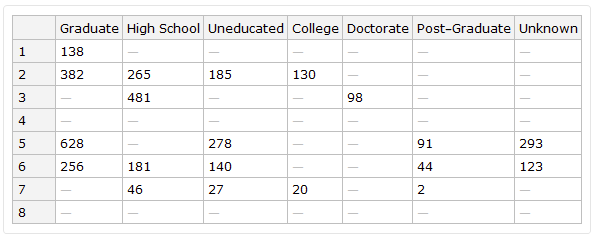
This technique will also work when multiple rows are missing values:

$ds2 = $ds[All, RandomSample[#, RandomInteger[Length[#]]] &];
$ds2[Keys[#] -> KeyUnion[Values[#]] & /* AssociationThread]

sparser table

$\endgroup$
4
  • $\begingroup$ Interesting. I suspected that length could be an issue, so I tried ds[KeyDrop[8]] (where ds is the name I gave the dataset), but is still was not rendered as a table. What is the difference here? $\endgroup$
    – Whelp
    Commented Feb 5, 2021 at 14:25
  • $\begingroup$ As far as I can tell, the Normal forms look the same between ds[KeyDrop[8]] and ds[KeyDrop[8]][KeyDrop[8]][Keys[#] -> KeyUnion[Values[#]] & /* AssociationThread], apart from order of keys. Can that be a factor? $\endgroup$
    – Whelp
    Commented Feb 5, 2021 at 14:28
  • 2
    $\begingroup$ Yes, the order of the keys is important. KeyUnion will not only supply missing keys but also normalize the order. $\endgroup$
    – WReach
    Commented Feb 5, 2021 at 14:31
  • $\begingroup$ That explains a lot! $\endgroup$
    – Whelp
    Commented Feb 5, 2021 at 14:33

Your Answer

By clicking “Post Your Answer”, you agree to our terms of service and acknowledge you have read our privacy policy.

Not the answer you're looking for? Browse other questions tagged or ask your own question.