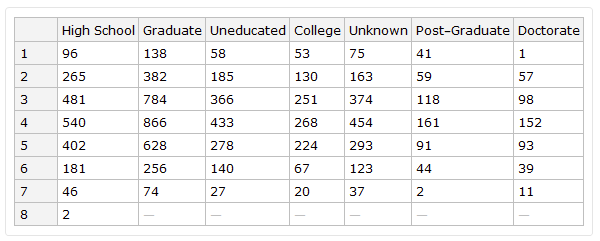
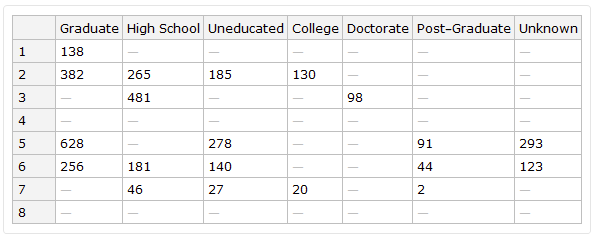
I have the following dataset:
Dataset[
 <|1 -> <|"High School" -> 96, "Graduate" -> 138, "Uneducated" -> 58,
"College" -> 53, "Unknown" -> 75, "Post-Graduate" -> 41,
"Doctorate" -> 1|>,
2 -> <|"Uneducated" -> 185, "Graduate" -> 382, "College" -> 130,
 "High School" -> 265, "Unknown" -> 163, "Post-Graduate" -> 59,
 "Doctorate" -> 57|>,
3 -> <|"High School" -> 481, "Uneducated" -> 366, "Graduate" -> 784,
"Unknown" -> 374, "Post-Graduate" -> 118, "College" -> 251,
"Doctorate" -> 98|>,
 4 -> <|"High School" -> 540, "Graduate" -> 866,
"Post-Graduate" -> 161, "Doctorate" -> 152, "Unknown" -> 454,
"College" -> 268, "Uneducated" -> 433|>,
5 -> <|"Graduate" -> 628, "Unknown" -> 293, "College" -> 224,
"Uneducated" -> 278, "Doctorate" -> 93, "High School" -> 402,
"Post-Graduate" -> 91|>,
6 -> <|"Graduate" -> 256, "High School" -> 181, "Doctorate" -> 39,
"College" -> 67, "Unknown" -> 123, "Uneducated" -> 140,
"Post-Graduate" -> 44|>,
7 -> <|"Unknown" -> 37, "Doctorate" -> 11, "High School" -> 46,
"Graduate" -> 74, "College" -> 20, "Uneducated" -> 27,
"Post-Graduate" -> 2|>, 8 -> <|"High School" -> 2|>|>
]
According to my understanding of the Dataset documentation, this should be displayed as a table where the numerical categories are the rows and the educational categories the columns. Instead it's displayed as a hierarchical data (rows of rows). Why is that?


