Reply to the comment.
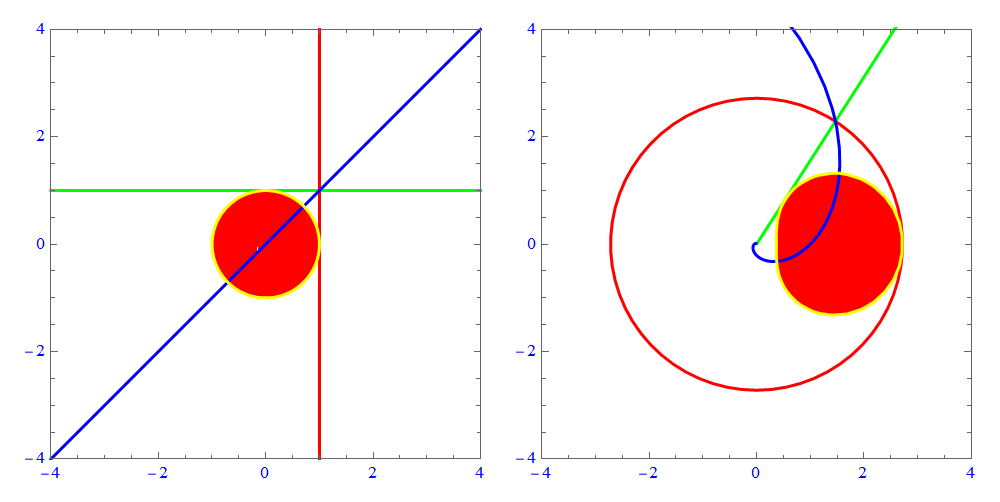
Use MeshShading to fill the region.
expr1 = {x, y};
expr2 = With[{z = x + I*y}, E^z // ReIm // ComplexExpand];
ParametricPlot[#, {x, -4, 4}, {y, -4, 4},
    MeshFunctions -> {#3 &, #4 &, #4 - #3 &, Sqrt[#3^2 + #4^2] &},
    Mesh -> {{1}, {1}, {0}, {1}},
    MeshShading -> {{{{Red, None}, {None, None}}, {{Red, None}, {None,
          None}}}, {{{None, None}, {None, None}}, {{None,
         None}, {None, None}}}},
    MeshStyle -> {{Thick, Red, Opacity[1]}, {Thick, Green,
       Opacity[1]}, {Thick, Blue, Opacity[1]}, {Thick, Yellow,
       Opacity[1]}}, Axes -> False, PlotRange -> 4,
    BoundaryStyle -> None,
    LabelStyle -> {FontFamily -> "Times", Blue}, PlotPoints -> 80,
    PlotStyle -> None] & /@ {expr1, expr2} // GraphicsRow

Simplify
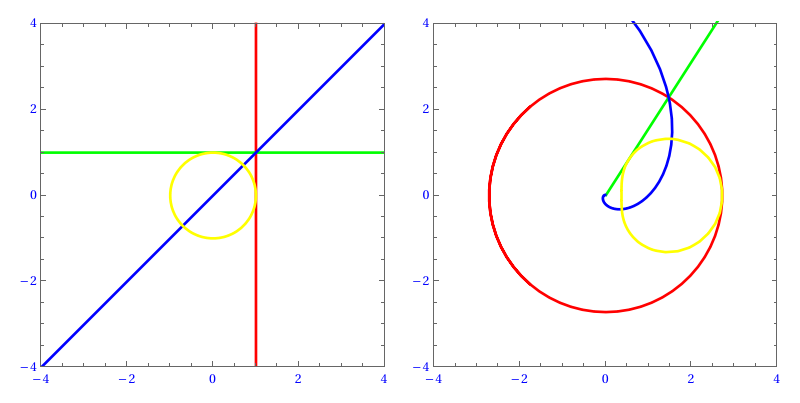
expr1 = {x, y};
expr2 = With[{z = x + I*y}, E^z // ReIm // ComplexExpand];
ParametricPlot[#, {x, -4, 4}, {y, -4, 4},
    MeshFunctions -> {#3 &, #4 &, #4 - #3 &, Sqrt[#3^2 + #4^2] &},
    Mesh -> {{1}, {1}, {0}, {1}},
    MeshStyle -> {{Thick, Red, Opacity[1]}, {Thick, Green,
       Opacity[1]}, {Thick, Blue, Opacity[1]}, {Thick, Yellow,
       Opacity[1]}}, Axes -> False, PlotRange -> 4,
    BoundaryStyle -> None,
    LabelStyle -> {FontFamily -> "Times", Blue}, PlotPoints -> 80,
    PlotStyle -> None] & /@ {expr1, expr2} // GraphicsRow

Original
expr = With[{z = x + I*y}, E^z // ReIm // ComplexExpand]
xy = ParametricPlot[{x, y}, {x, -2, 2}, {y, -2, 2},
   MeshFunctions -> {#1 &, #2 &, #2 - #1 &, Sqrt[#1^2 + #2^2] &},
   Mesh -> {{1}, {1}, {0}, {1}},
   MeshStyle -> {{Thick, Red, Opacity[1]}, {Thick, Green,
      Opacity[1]}, {Thick, Blue, Opacity[1]}, {Thick, Yellow,
      Opacity[1]}}, PlotPoints -> 50, FrameLabel -> {x, y},
   PlotStyle -> None];
uv = ParametricPlot[expr, {x, -4, 4}, {y, -4, 4},
   MeshFunctions -> {#3 &, #4 &, #4 - #3 &, Sqrt[#3^2 + #4^2] &},
   Mesh -> {{1}, {1}, {0}, {1}},
   MeshStyle -> {{Thick, Red, Opacity[1]}, {Thick, Green,
      Opacity[1]}, {Thick, Blue, Opacity[1]}, {Thick, Yellow,
      Opacity[1]}}, Axes -> False, PlotRange -> 8,
   BoundaryStyle -> None, FrameLabel -> {u, v},
   LabelStyle -> {FontFamily -> "Times", Blue}, PlotPoints -> 80,
   PlotStyle -> None];
GraphicsRow[{xy, uv}]


