I'm trying to solve the Schrödinger equation for the hydrogen atom without made the variable separation of the polar and radial coordinate. It is my test code to extrapolate to another system with its polar symmetry broken. Explicitly, I wish to solve
$$ -\frac{\hbar^2}{2m_e}\left[\frac{1}{r^2}\frac{\partial}{\partial r}\left(r^2\frac{\partial\psi(r,\theta)}{\partial r}\right)+\frac{1}{r^2\sin\theta}\frac{\partial}{\partial\theta}\left(\sin\theta\frac{\partial\psi(r,\theta)}{\partial\theta}\right)-\frac{m^2}{r^2\sin^2\theta}\psi(r,\theta)\right]=E\psi(r,\theta) $$
To do that, I use NDEigensystem as follows:
- First, I define the Hamiltonian:
H=-(h^2/(2 me)) (1/r^2 D[r^2 D[y[r, t], r], r] +
   1/(r^2 Sin[t])
     D[Sin[t] D[y[r, t], t], t] -
   m^2/(r^2 Sin[t]^2) y[r, t])-((Z e^2)/(r))y[r,t];
- Define my constants for the case $ m = 0 $
h = 1;
me = 1;
Z = 1;
e = 1;
m = 0;
a0 = (4 π ϵ0 h^2)/(m e^2);
- I use the
NDEigensystemroutine. I add the termS*y[r,t]to ensure the correct eigenvalue ordering as was discussed here.
S=10;
{valsHH, funsHH} =
  NDEigensystem[{H+S*y[r,t]}, y[r,t], {r, 0, 100}, {t,
    0,π}, 5,
   Method -> {"SpatialDiscretization" -> {"FiniteElement", \
{"MeshOptions" -> {"MaxCellMeasure" -> 0.01}}}}];
- The eigenvalues that I obtain are:
valsHH-S
{-0.500091, -0.125012, -0.125001, -0.0555551, -0.0550086}
Now, the correct eigenvalues should be
{-0.5, -0.125, -0.0555556, -0.03125, -0.02}
Do you know how to correct it?
Edit 1: Degeneracy + Mesh + Upper limit of radial coordinate as possible solution
I have analyzed the results and I found that the correct eigenvalues are indeed in the outputs. Nevertheless, there are other eigenvalues that are approximate to the analytic ones.
Also, I have added some boundary condition:
H=-(h^2/(2 me)) (1/r^2 D[r^2 D[y[r, t], r], r] +
   1/(r^2 Sin[t])
     D[Sin[t] D[y[r, t], t], t] -
   m^2/(r^2 Sin[t]^2) y[r, t])-((Z e^2)/(r))y[r,t];

h = 1;
me = 1;
Z = 1;
e = 1;
m = 0;
a0 = (4 π ϵ0 h^2)/(m e^2);
S=10;

{valsHH, funsHH} =
  NDEigensystem[{H + S*y[r, t],
    DirichletCondition[y[r, t] == 0.,
     r == 0 && 0 <= t <=Pi]}, y[r, t], {r, 0,
    500}, {t, 0,Pi}, 6,
   Method -> {"Eigensystem" -> {"Arnoldi", "Criteria" -> "RealPart"},
     "SpatialDiscretization" -> {"FiniteElement", {"MeshOptions" -> \
{"MaxCellMeasure" -> 0.005}}}}];

valsHH - S

Out[]= {-0.44711, -0.125, -0.118078, -0.0555375, -0.0534163, -0.0309502}
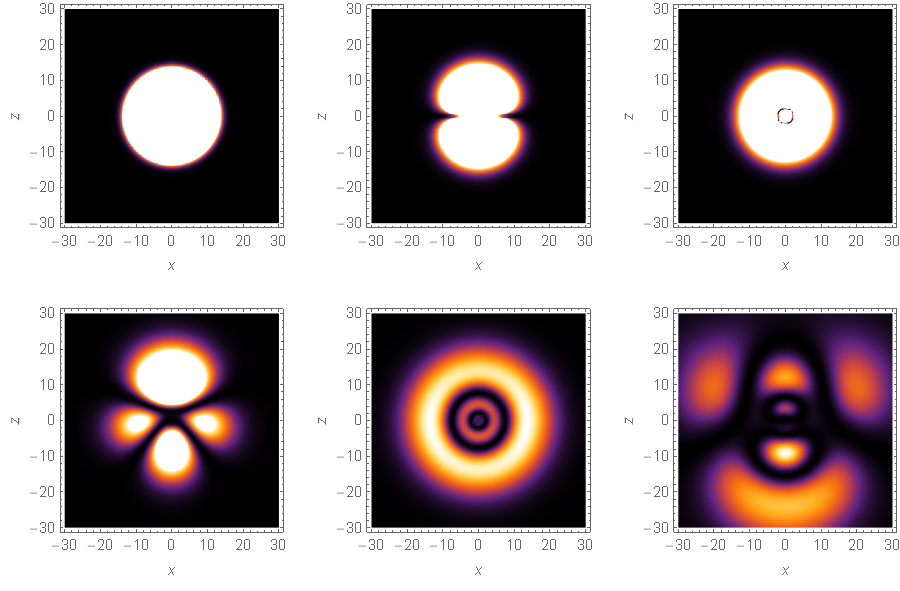
Now, I analyze the probability density.
G[n_] := DensityPlot[
   Abs[r*funsHH[[n]]]^2 /. r -> Sqrt[x^2 + z^2] /. \[Theta] ->
     ArcTan[z, Sqrt[x^2]] , {x, -30, 30}, {z, -30, 30},
   ColorFunction -> "SunsetColors", PlotPoints -> 80,
   PlotLegends -> None, FrameLabel -> Automatic];
GraphicsGrid[{Table[G[i], {i, 1, 3}], Table[G[i], {i, 4, 6}]}]
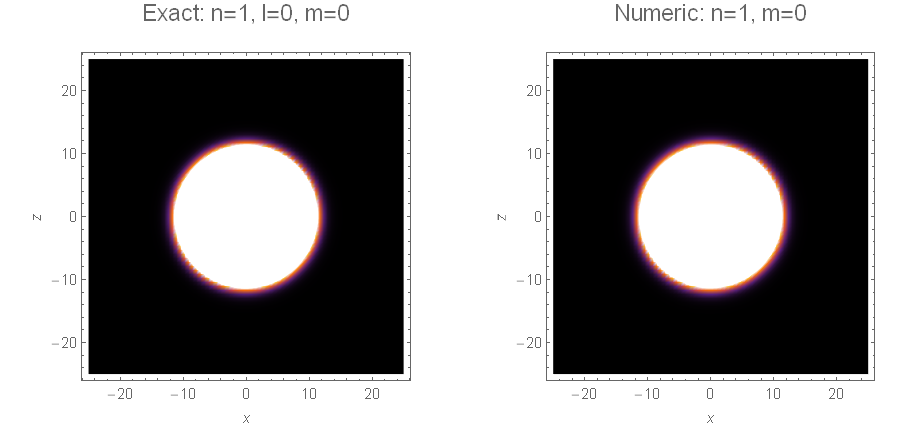
Now, by comparing with the exact solution:
F[r_, t_, f_, n_, l_, m_] :=
  Abs[r*Sqrt[((2 Z)/(n a0))^3*(n - l - 1)!/(2 n ((n + l)!)^3)]
     Exp[-((Z r)/(n a0))] ((2 Z r)/(n a0))^
    l LaguerreL[n - l - 1, 2 l + 1, (2 Z r)/(
     n a0)] SphericalHarmonicY[l, m, t, f]]^2;
GraphicsGrid[{{DensityPlot[
    F[Sqrt[x^2 + z^2], ArcTan[z, Sqrt[x^2]], ArcTan[0, x], 1, 0,
     0] , {x, -25, 25}, {z, -25, 25}, ColorFunction -> "SunsetColors",
     PlotPoints -> 80, PlotLegends -> None, FrameLabel -> Automatic,
    PlotLabel -> Style["Exact: n=1, l=0, m=0", 15]],
   DensityPlot[
    Abs[r*funsHH[[1]]]^2 /. r -> Sqrt[x^2 + z^2] /. t ->
      ArcTan[z, Sqrt[x^2]] , {x, -25, 25}, {z, -25, 25},
    ColorFunction -> "SunsetColors", PlotPoints -> 80,
    PlotLegends -> None, FrameLabel -> Automatic,
    PlotLabel -> Style["Numeric: n=1, m=0", 15]]}},
 Spacings -> {25, -50}]
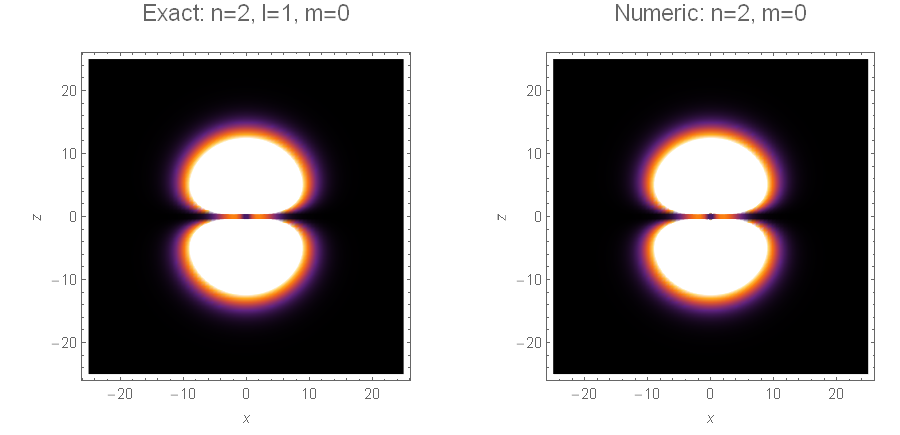
GraphicsGrid[{{DensityPlot[
    F[Sqrt[x^2 + z^2], ArcTan[z, Sqrt[x^2]], ArcTan[0, x], 2, 1,
     0] , {x, -25, 25}, {z, -25, 25}, ColorFunction -> "SunsetColors",
     PlotPoints -> 80, PlotLegends -> None, FrameLabel -> Automatic,
    PlotLabel -> Style["Exact: n=1, l=1, m=0", 15]],
   DensityPlot[
    Abs[r*funsHH[[2]]]^2 /. r -> Sqrt[x^2 + z^2] /. t ->
      ArcTan[z, Sqrt[x^2]] , {x, -25, 25}, {z, -25, 25},
    ColorFunction -> "SunsetColors", PlotPoints -> 80,
    PlotLegends -> None, FrameLabel -> Automatic,
    PlotLabel -> Style["Numeric: n=2, m=0", 15]]}},
 Spacings -> {25, -50}]
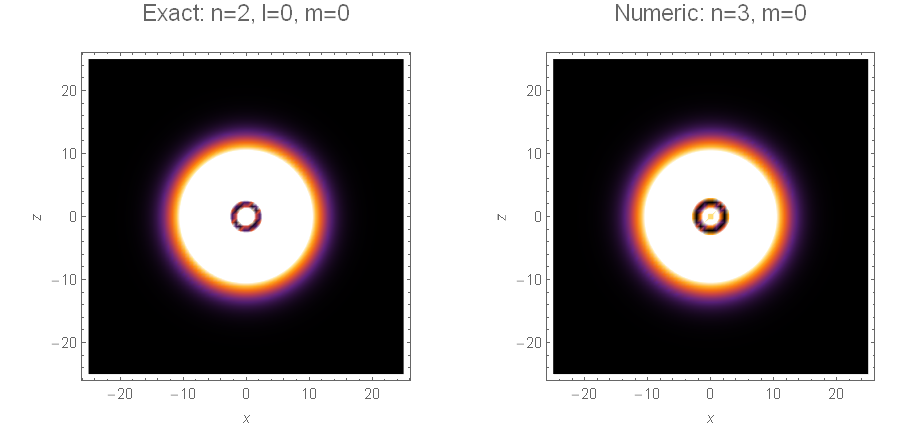
GraphicsGrid[{{DensityPlot[
    F[Sqrt[x^2 + z^2], ArcTan[z, Sqrt[x^2]], ArcTan[0, x], 2, 0,
     0] , {x, -25, 25}, {z, -25, 25}, ColorFunction -> "SunsetColors",
     PlotPoints -> 80, PlotLegends -> None, FrameLabel -> Automatic,
    PlotLabel -> Style["Exact: n=2, l=0, m=0", 15]],
   DensityPlot[
    Abs[r*funsHH[[3]]]^2 /. r -> Sqrt[x^2 + z^2] /. t ->
      ArcTan[z, Sqrt[x^2]] , {x, -25, 25}, {z, -25, 25},
    ColorFunction -> "SunsetColors", PlotPoints -> 80,
    PlotLegends -> None, FrameLabel -> Automatic,
    PlotLabel -> Style["Numeric: n=2, m=0", 15]]}},
 Spacings -> {25, -50}]
GraphicsGrid[{{DensityPlot[
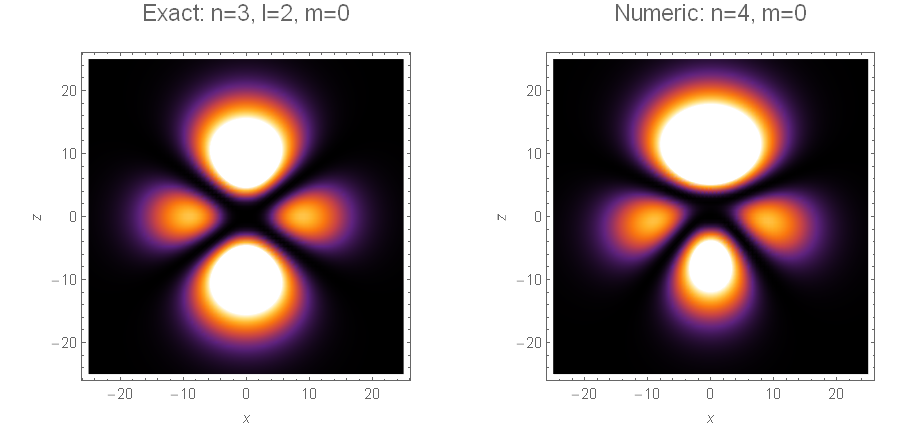
    F[Sqrt[x^2 + z^2], ArcTan[z, Sqrt[x^2]], ArcTan[0, x], 3, 2,
     0] , {x, -25, 25}, {z, -25, 25}, ColorFunction -> "SunsetColors",
     PlotPoints -> 80, PlotLegends -> None, FrameLabel -> Automatic,
    PlotLabel -> Style["Exact: n=3, l=2, m=0", 15]],
   DensityPlot[
    Abs[r*funsHH[[4]]]^2 /. r -> Sqrt[x^2 + z^2] /. t ->
      ArcTan[z, Sqrt[x^2]] , {x, -25, 25}, {z, -25, 25},
    ColorFunction -> "SunsetColors", PlotPoints -> 80,
    PlotLegends -> None, FrameLabel -> Automatic,
    PlotLabel -> Style["Numeric: n=4, m=0", 15]]}},
 Spacings -> {25, -50}]
GraphicsGrid[{{DensityPlot[
    F[Sqrt[x^2 + z^2], ArcTan[z, Sqrt[x^2]], ArcTan[0, x], 3, 0,
     0] , {x, -25, 25}, {z, -25, 25}, ColorFunction -> "SunsetColors",
     PlotPoints -> 80, PlotLegends -> None, FrameLabel -> Automatic,
    PlotLabel -> Style["Exact: n=3, l=0, m=0", 15]],
   DensityPlot[
    Abs[r*funsHH[[5]]]^2 /. r -> Sqrt[x^2 + z^2] /. t ->
      ArcTan[z, Sqrt[x^2]] , {x, -25, 25}, {z, -25, 25},
    ColorFunction -> "SunsetColors", PlotPoints -> 80,
    PlotLegends -> None, FrameLabel -> Automatic,
    PlotLabel -> Style["Numeric: n=5, m=0", 15]]}},
 Spacings -> {25, -50}]
GraphicsGrid[{{DensityPlot[
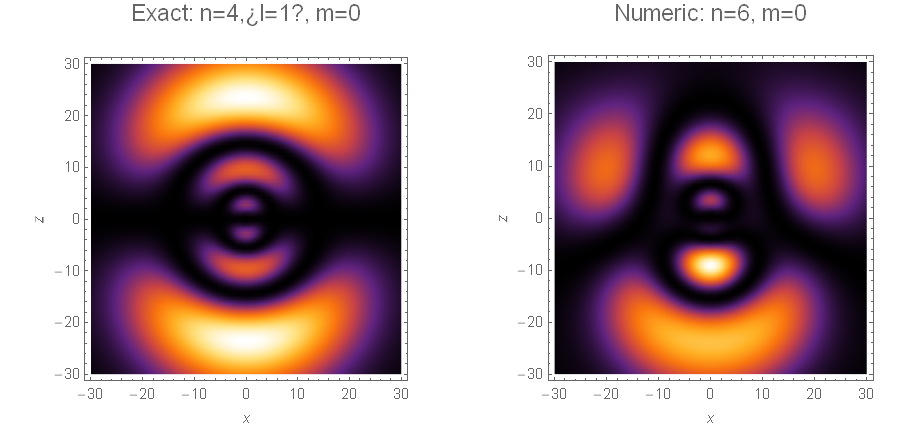
    F[Sqrt[x^2 + z^2], ArcTan[z, Sqrt[x^2]], ArcTan[0, x], 4, 1,
     0] , {x, -30, 30}, {z, -30, 30}, ColorFunction -> "SunsetColors",
     PlotPoints -> 80, PlotLegends -> None, FrameLabel -> Automatic,
    PlotLabel -> Style["Exact: n=4,¿l=1?, m=0", 15]],
   DensityPlot[
    Abs[r*funsHH[[6]]]^2 /. r -> Sqrt[x^2 + z^2] /. t ->
      ArcTan[z, Sqrt[x^2]] , {x, -30, 30}, {z, -30, 30},
    ColorFunction -> "SunsetColors", PlotPoints -> 80,
    PlotLegends -> None, FrameLabel -> Automatic,
    PlotLabel -> Style["Numeric: n=6, m=0", 15]]}},
 Spacings -> {25, -50}]
From the above, maybe the code is giving the eigenvalues with different $l$ and same $m$. Also, by refining the mesh and a bigger $r_\text{max}$, it is possible to get better wave functions.


1/0error messages, but like obviously the hydrogen atom support many degenerate states. What do you get when you plot the wave functions? $\endgroup$ϵ0? What is numeric value for this parameter ? $\endgroup$