I have only recently discovered Mathematica so I am quite weak with it, posting here as it seems to be the most comprehensive forum online.
My question is entirely based off a previous very high quality post namely
Circular membrane vibration simulation
I decided to make a new post for this since that post is nearly 6 years old now.
In the answers user 'Jens' describes the code for constructing the traditional Chladni Patterns for a circular membrane as the follows.
fXY[n_, k_][x_?NumericQ, y_?NumericQ] :=
 BesselJ[n, k Sqrt[x^2 + y^2]] Cos[n ArcTan[y, x]]

wavePattern[n_, j_] :=
 Module[{k0 = N[BesselJZero[n, j]]},
  DensityPlot[fXY[n, k0][x, y], {x, -1.1, 1.1}, {y, -1.2, 1.1},
   RegionFunction -> Function[{x, y}, x^2 + y^2 < 1],
   ColorFunction ->
    Function[{x},
     Blend[{White, Darker@Brown, White}, 2 ArcTan[10 x]/Pi + .5]],
   ColorFunctionScaling -> False, PlotPoints -> 100,
   MaxRecursion -> 0,
   Epilog ->
    Inset[Grid[{{"n", n}, {"j", j}}, Frame -> All], {-.9, .9}],
   BaseStyle -> {FontFamily -> "Arial"}]]

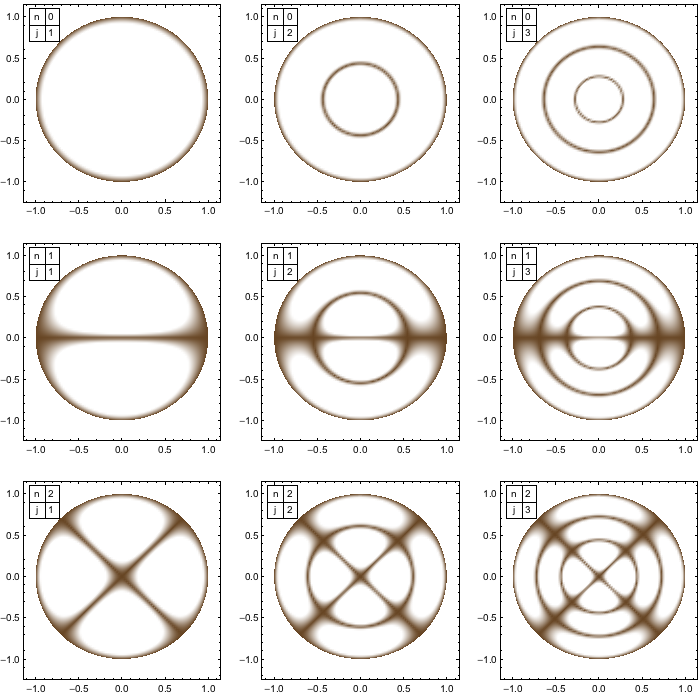
Show[GraphicsGrid@Table[wavePattern[m, n], {m, 0, 2}, {n, 1, 3}],
 ImageSize -> 700]
which outputs the following
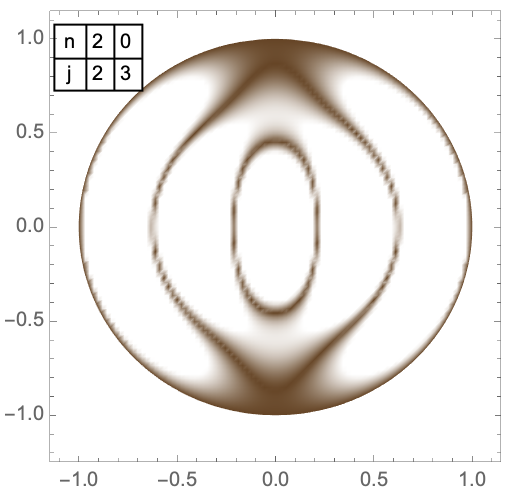
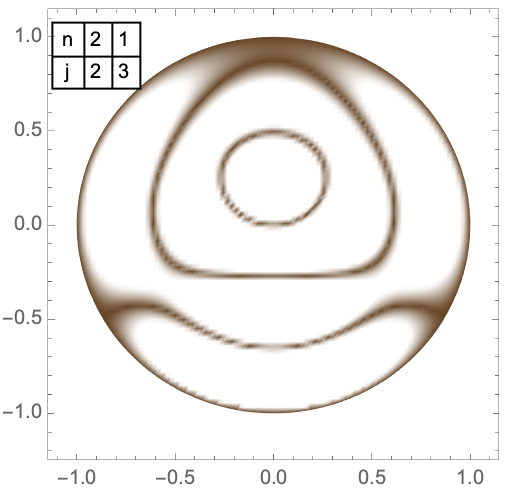
I want to know how I can be able to superimpose (by adding) the values of say wavePattern[2, 2] and wavePattern[3, 0]. And plot the values that occur, in a similar way. Which will displays the Chladni Pattern when both the modes are occurring simultaneously.
The reason I'm asking this question (not relevant to the question) : I recently saw a video lecture that claimed the seemingly non traditional (complex) Chladni patterns that are observed by modern experiments that use tone generators are actually the result of the superimposition of the basic modes that are predicted by the theoretical formula. This has me highly intrigued as I had seen nearly all experiments show the formation of Chladni patterns that don't match the "basic" modes. This seems to be a ingeniously simple solution which I seem to have missed and couldn't find anywhere else online. I want to verify it by using Mathematica, and since there already exists some great code I'm hoping someone here can help me tinker it in the form I am looking to do.


