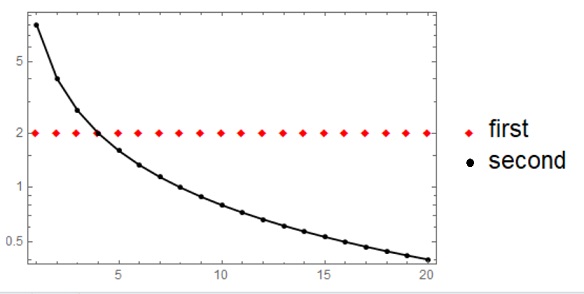
You can do all in a single ListLogPlot:
ListLogPlot[{data1, data2},
 Joined -> {False, True},
 Frame -> True,
 PlotMarkers -> {{"◆", 10}, {"●", 10}},
 PlotStyle -> {Red, Black},
 Mesh -> All,
 PlotLegends -> {"first", "second"}]
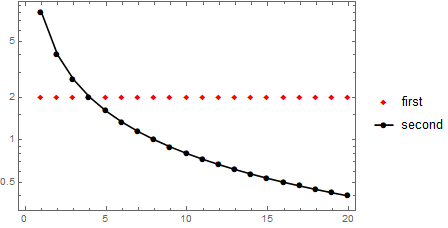
Altenatively, add the option PlotLegends in each plot. Show combines the legends automatically:
a = ListLogPlot[data1, Frame -> True,
   PlotMarkers -> Style["◆", 10, Red],
   PlotLegends -> {"first"}];

b = ListLogPlot[data2, Frame -> True, Joined -> True,
   PlotStyle -> Black, Mesh -> All,
   PlotLegends -> LineLegend[{"second"}, LegendMarkers -> {Automatic, 10}]];

Show[a, b, PlotRange -> All, Axes -> None]
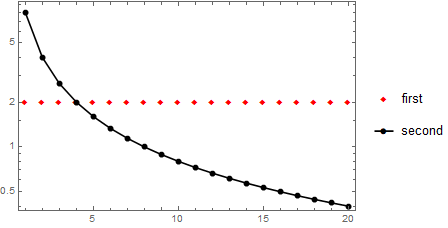
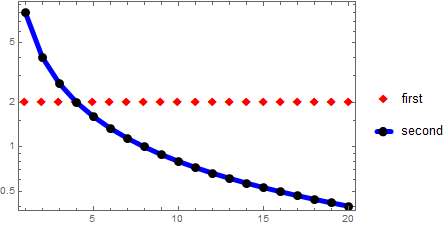
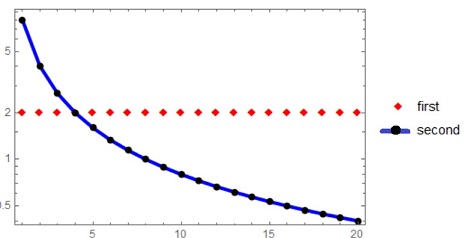
Update: To get a picture like the second picture in OP we can use PlotStyle. If we specify different colors for points and lines in b using, say,
   PlotStyle ->  Directive[CapForm["Round"], AbsoluteThickness[5], Black,
     LineColor -> Blue]
the lines and markers in the legend are automatically colored to match the specification in PlotStyle.
So, we can use the first approach as follows:
ListLogPlot[{data1, data2}, Joined -> {False, True}, Frame -> True,
 PlotMarkers -> {{"◆", 16}, {"●", 14}},
 PlotStyle -> {Red, Directive[CapForm["Round"], AbsoluteThickness[5], Black,
    LineColor -> Blue]},
 Mesh -> All, PlotLegends -> {"first", "second"}]
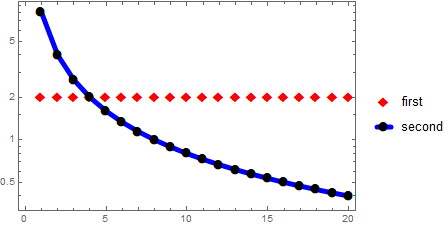
And modify the second approach as follows:
a = ListLogPlot[data1, Frame -> True,
   PlotMarkers -> Style["◆", 14, Red],
   PlotLegends -> {"first"}];

b = ListLogPlot[data2, Frame -> True, Joined -> True,
   PlotStyle ->  Directive[CapForm["Round"], AbsoluteThickness[5], Black,
     LineColor -> Blue],
   Mesh -> All,
   MeshStyle -> AbsolutePointSize[9],
   PlotLegends -> LineLegend[{"second"}, LegendMarkers -> {Automatic, 14}]];

Show[a, b, PlotRange -> All, Axes -> None]
