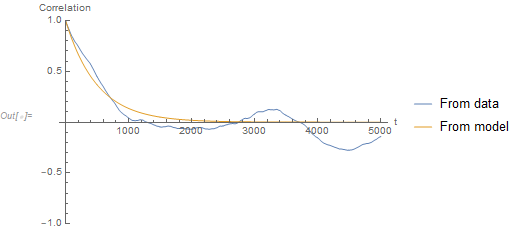
This is just an extended comment as it doesn't answer the need for the correlation of $X(0)$ and $X(t)$ to be proportional to $e^{-t/\tau_c}$.
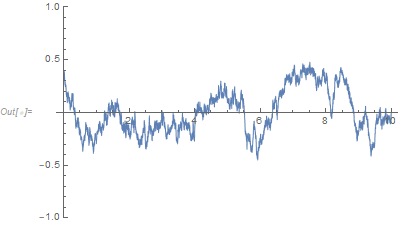
I'm unaware of a specific process in Mathematica that directly generates a random process between -1 and +1 but you can use TransformedProcess and the inverse of the Fisher z-transformation to convert a process between $-\infty$ and $+\infty$ to be between -1 and +1.
p = TransformedProcess[(-1 + E^(2 y[t]))/(1 + E^(2 y[t])),
  y \[Distributed] OrnsteinUhlenbeckProcess[0, 0.4, 0.8], t]
SeedRandom[123]
data = RandomFunction[p, {0, 10, 0.001}]
ListLinePlot[data, PlotRange -> {Automatic, {-1, 1}}]

ListPlot[{CorrelationFunction[data, {5000}], Table[{t, Exp[-t/500]}, {t, 0, 5000}]},
 PlotRange -> {Automatic, {-1, 1}}, PlotLegends -> {"From data", "From model"}, Joined -> True,
 AxesLabel -> {"t", "Correlation"}]


OrnsteinUhlenbeckProcessis indeed implemented. Can you explain how it relates to the process you want? I don't think you are providing enough information for people to help you out. $\endgroup$