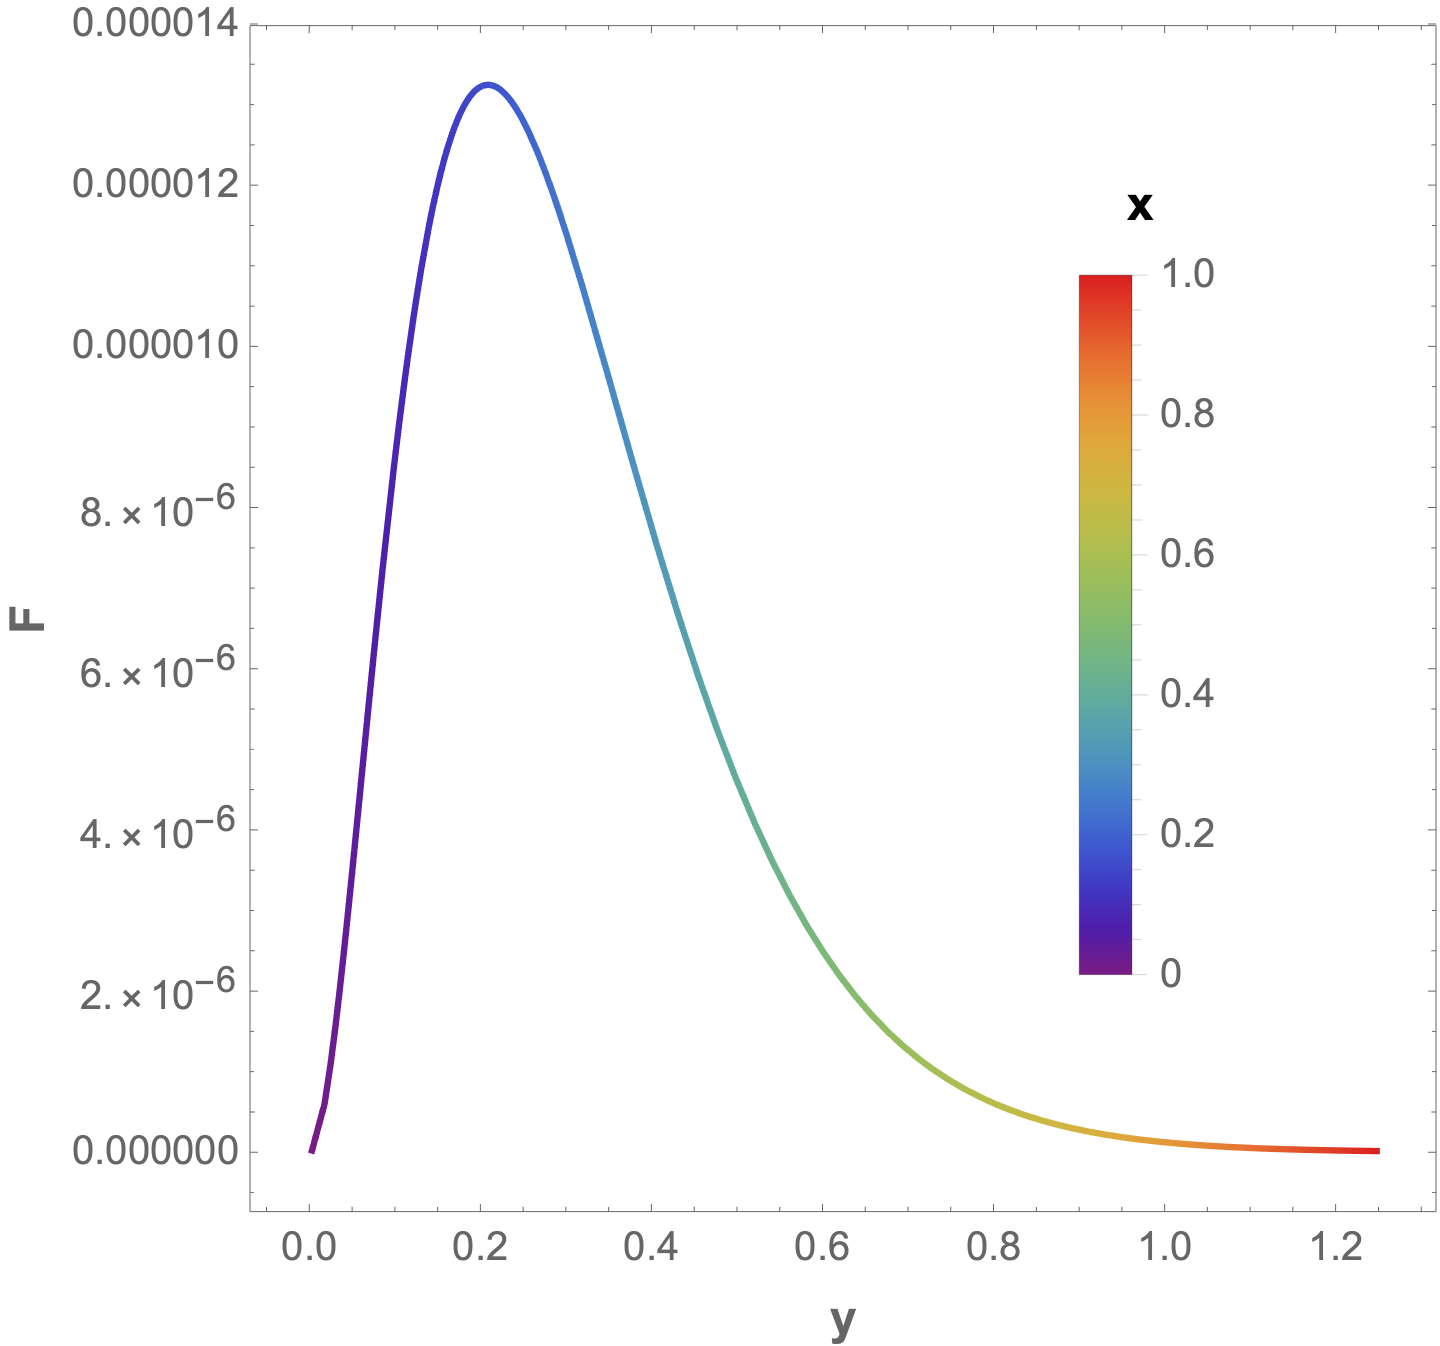
The paper consists a no of plots which have color bars as axis but I think all of them followed the same procedure, I want to plot such good looking plots (like fig 1 or 2 or any)can anybody guide me how to do them, since I am very new to Mathematica
arxiv.org/abs/1910.00234
I think the problem is very similar like the below mentioned example
v = 246
   E1 = 9000

  PT = ((Subscript[E1, T]*v)/(
 Subscript[v, n]*E1))/((Subscript[v, n]/Subscript[T, n])^-1*(v/
  E1)) - 7*(Log[Subscript[v, n]]/Subscript[T, n]) +
   Log[Subscript[T, n]/100]
  Subscript[v, n]/Subscript[T, n] = {1, 2, 3, 4, 5, 6, 7, 8, 9, 10};
   Subscript[T, n] = {300, 500, 469, 650, 546, 389, 456, 411, 523,
    700};
    ((Subscript[E1, T]*v)/(Subscript[v, n]*E1)) =
     RandomReal[{1, 3.1}, {10}]
Now I have to randomly vary the last ratio to some range and make it the color bar axis and the values for PT and v_n/T_n for each ratios can be plotted PT vs v_n/T_n plot making the ratio as color axis


F[x,y]vs.y, not just one point! Please, make a more realistic example. $\endgroup$y == Sqrt[Tan[x]]colored according to the value ofF? $\endgroup$