1
$\begingroup$

I created my plot using using this input:

Manipulate[solution[t_] = NDSolve[{
     Derivative[1][w][t] == - k1  S w[t] + k2   x[t] - 
              k7 H  w[t] + k8  y[t], 
     Derivative[1][x][t] == - k2  x[t] + k1 S w[t] - k3 H x[t] + 
              k4  z[t], 
     Derivative[1][y][t] == -k8  y[t] + k7 H w[t] - k5  S y[t] + 
              k6 z[t], 
     Derivative[1][z][t] == - k4  z[t] + k3 H  x[t] - k6  z[t] + 
              k5 S y[t], w[0] == 1, x[0] == 0, y[0] == 0, 
     z[0] == 0}, {w [t],
           x [t], y [t], z [t]}, {t, 0, 10}][[1, All, 2]]; 
  Plot[solution[t], {t, 0, 10}], {{k1, 1}, 0.01, 5, 
    Appearance -> "Labeled"}
   , {{k2, 1}, 0.01, 5, Appearance -> "Labeled"}
   , {{k3, 1}, 0.01, 5, Appearance -> "Labeled"}
   , {{k4, 1}, 0.01, 5, Appearance -> "Labeled"} , {{k5, 1}, 0.01, 5, 
    Appearance -> "Labeled"} , {{k6, 1}, 0.01, 5, 
    Appearance -> "Labeled"} , {{k7, 1}, 0.01, 5, 
    Appearance -> "Labeled"} , {{k8, 1}, 0.01, 5, 
    Appearance -> "Labeled"} , {{H, 1}, 0.1, 5, 
    Appearance -> "Labeled"}, {{S, 1}, 0.01, 5, 
    Appearance -> "Labeled"} , 
  TrackedSymbols :> {k1, k2, k3, k4, k5, k6,  k7, k8, H, S}]

I now want to plot the solutions function versus S. Any suggestions?

$\endgroup$
1
  • $\begingroup$ you might want to check out ParametricNDSolve (new in 9). $\endgroup$
    – chuy
    Commented Apr 4, 2013 at 21:35

1 Answer 1

2
$\begingroup$

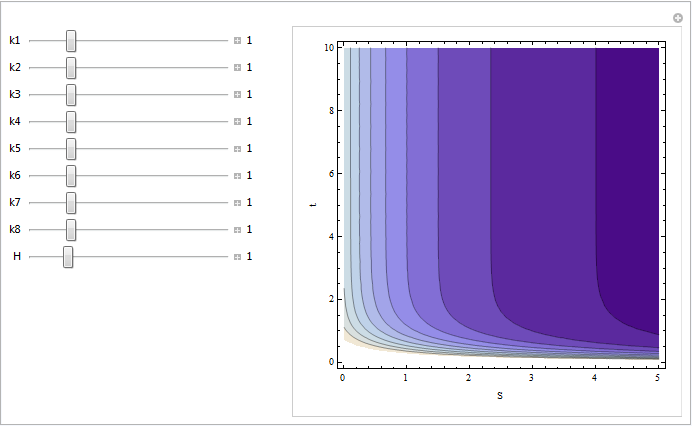
S is just a parameter. Normally you'd plot your solutions as a function of t given values of the parameters. If you want to plot it also against one of its parameters (S in this case) you can either choose to plot it for a fixed value of t or choose a 3D plot (Plot3D, ContourPlot, DensityPlot) and plot against both S and t.

The function ParametricNDSolve, introduced in v9, comes in handy here.

Note that I plot only W against S and t, but the other function go likewise.

Manipulate[solution = ParametricNDSolve[{
    Derivative[1][w][t] == - k1  S w[t] + k2   x[t] - 
             k7 H  w[t] + k8  y[t], 
    Derivative[1][x][t] == - k2  x[t] + k1 S w[t] - k3 H x[t] + 
             k4  z[t], 
    Derivative[1][y][t] == -k8  y[t] + k7 H w[t] - k5  S y[t] + 
             k6 z[t], 
    Derivative[1][z][t] == - k4  z[t] + k3 H  x[t] - k6  z[t] + 
             k5 S y[t], w[0] == 1, x[0] == 0, y[0] == 0, 
    z[0] == 0}, {w,
          x , y , z }, {t, 0, 10}, {S}];
 ContourPlot[w[S][t] /. solution // Evaluate, {S, 0.01, 5}, {t, 0, 10}, 
  FrameLabel -> {"S", "t"}], 
 {{k1, 1}, 0.01, 5,   Appearance -> "Labeled"}
   , {{k2, 1}, 0.01, 5, Appearance -> "Labeled"}
   , {{k3, 1}, 0.01, 5, Appearance -> "Labeled"}
   , {{k4, 1}, 0.01, 5, Appearance -> "Labeled"} , {{k5, 1}, 0.01, 5, 
    Appearance -> "Labeled"} , {{k6, 1}, 0.01, 5, 
    Appearance -> "Labeled"} , {{k7, 1}, 0.01, 5, 
    Appearance -> "Labeled"} , {{k8, 1}, 0.01, 5, 
    Appearance -> "Labeled"} , {{H, 1}, 0.1, 5, 
    Appearance -> "Labeled"} , 
  TrackedSymbols :> {k1, k2, k3, k4, k5, k6,  k7, k8, H}]

enter image description here

$\endgroup$

Your Answer

By clicking “Post Your Answer”, you agree to our terms of service and acknowledge you have read our privacy policy.

Not the answer you're looking for? Browse other questions tagged or ask your own question.