4
$\begingroup$

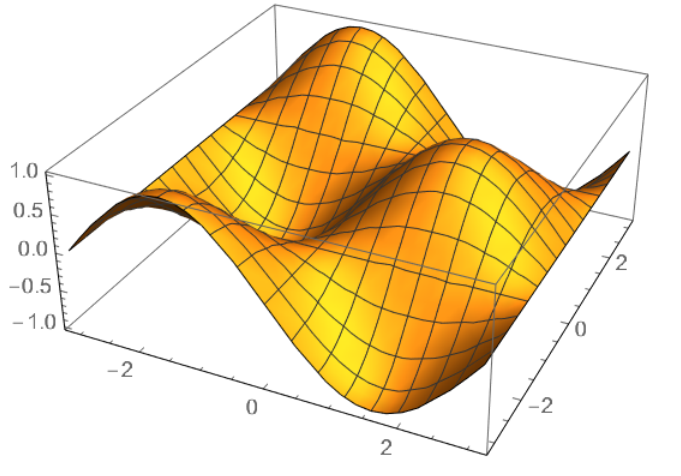
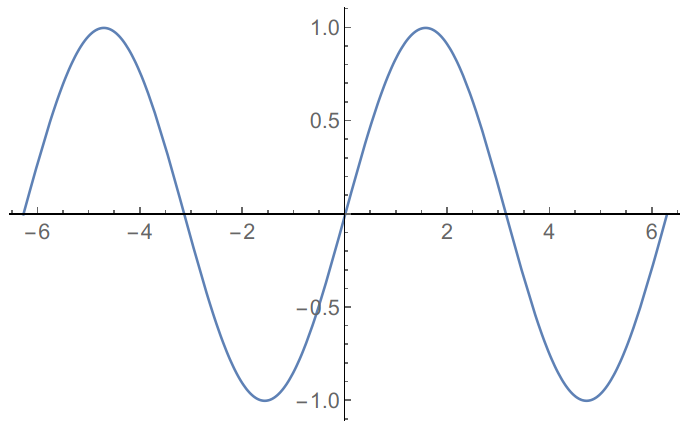
I can get crisp, anti-aliased 2D plots but not 3D.

2d 3d

Anti-aliasing is set to 1 in Graphics options. In the Documentation center, 3D plots look good when I open it, especially the ticks and tick labels but when I recompile the plots, they lose their quality. I tried various RenderingOptions but none seem to work. My output of inxi -G is

Graphics:  Device-1: Intel UHD Graphics 620 driver: i915 v: kernel 
           Display: x11 server: X.Org 1.20.8 driver: intel unloaded: modesetting resolution: 1920x1080~60Hz 
           OpenGL: renderer: Mesa Intel UHD Graphics 620 (KBL GT2) v: 4.6 Mesa 20.1.3 

I am running Mathematica 12.1 on Manjaro KDE.

Edit:

David G. Stork's answer makes the surface of the 3D plot better but I would like to make the tick labels and tick marks crisp and smooth as in 2D plot if possible.

$\endgroup$
2
  • $\begingroup$ Is it a question about plotting or exporting the plot? $\endgroup$
    – yarchik
    Commented Jul 27, 2020 at 22:08
  • $\begingroup$ @yarchik Plotting, although answers regarding exporting the plot would be appreciated as well. $\endgroup$ Commented Jul 28, 2020 at 7:20

2 Answers 2

4
$\begingroup$

Just use a large number of plot points:

PlotPoints->100

And save as .eps or .pdf.

$\endgroup$
1
  • $\begingroup$ Thanks, that solves the problem for the surface in the plot. Is there any way to make the axis tick labels crisp as well? $\endgroup$ Commented Jul 26, 2020 at 19:24
1
$\begingroup$
SetOptions[Plot3D, 
  BaseStyle -> {FontFamily -> "Times", FontSize -> 15}, 
  LabelStyle -> Directive[Black, Bold, Medium], 
  TicksStyle -> Directive[Small, Blue]];
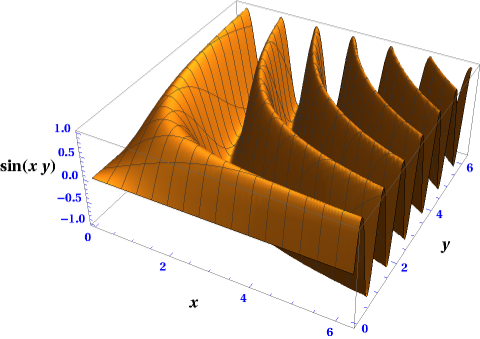
Plot3D[Sin[x*y], {x, 0, 2 \[Pi]}, {y, 0, 2 \[Pi]}, PlotPoints -> 50, 
 AxesLabel -> {x, y, Sin[x*y]}]

enter image description here

$\endgroup$

Your Answer

By clicking “Post Your Answer”, you agree to our terms of service and acknowledge you have read our privacy policy.

Not the answer you're looking for? Browse other questions tagged or ask your own question.