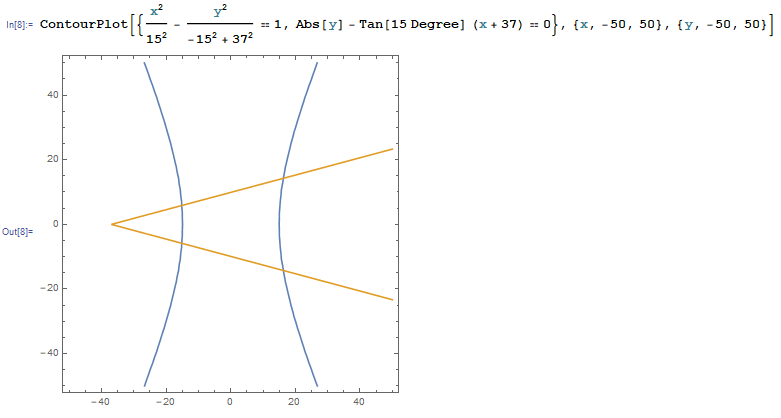
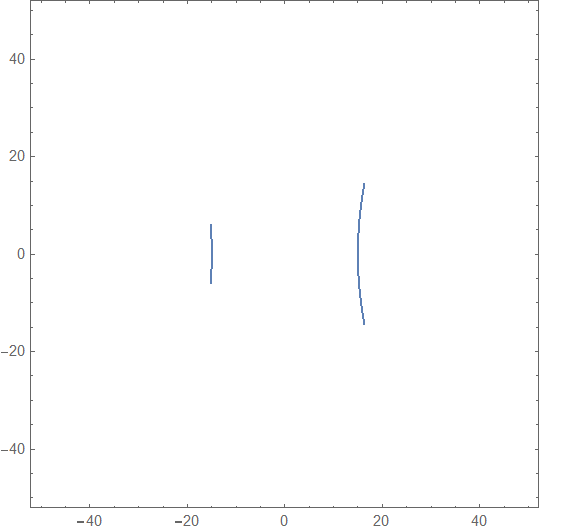
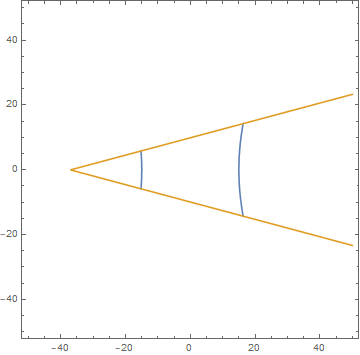
I want to plot implicit plots in certain regions. For example plot the section of the hyperbola that is in between the wedge. But I could not find out how to do this. Multiplying the first expression with a <> expression does not work.
2 Answers
$\begingroup$
$\endgroup$
2
Add RegionFunctionas an option
ContourPlot[x^2/15^2 - y^2/(-15^2 + 37^2) == 1, {x, -50, 50}, {y, -50, 50},
RegionFunction ->Function[{x, y},y <= Tan[15 Degree] (x + 37) && y >= - Tan[15 Degree] (x + 37)]]
-
$\begingroup$ How would I have different regions for different implicit functions on the same window? $\endgroup$ Commented Jul 20, 2020 at 15:57
-
$\begingroup$ Combine ContourPlots using Show or create a RegionFunction with several implicit regions. $\endgroup$ Commented Jul 20, 2020 at 19:10
$\begingroup$
$\endgroup$
You can also use ConditionalExpression as follows:
ContourPlot[{ConditionalExpression[x^2/15^2 - y^2/(-15^2 + 37^2),
    Abs[y] <= Tan[15 Degree] (x + 37)] == 1,
  Abs[y] == Tan[15 Degree] (x + 37)} ,
 {x, -50, 50}, {y, -50, 50}]


