9
$\begingroup$

I'm working in a finite element mesh generator. I built this function which generates an 8 node mesh (polynomials of order 2) without any interior node:

    (*Generate Grid Mesh of dimensions axb with nx divisions in x and ny \
    divisions in y*)
    GenerateGridMesh[aa_, bb_, nx_, ny_, order_] := 
      Block[{x = 0., y = 0., dx, dy, meshnodes = {}, i, j, 
        meshtopology = {}, allcoords, k, topolsz, l, data, c, a, b},
       k = 0;
       
       meshnodes = {};
       dx = aa/(2 nx);
       dy = bb/(2 ny);
       For[i = 1, i <= 2 ny + 1, i++,
        If[OddQ[i] == True,
         For[j = 1, j <= 2 nx + 1, j++,
           AppendTo[meshnodes, {x, y}];
           x += dx ;
           ];
         ,
         For[k = 1, k <= nx + 1, k++,
           AppendTo[meshnodes, {x, y}];
           x += 2 dx ;
           ];
         ];
        x = 0;
        y += dy;
        ];
       meshtopology = {};
       b = 0;
       a = 1;
       l = 0;
       c = 3 nx + 2;
       For[i = 1, i <= ny, i++,
        For[j = 1, j <= nx, j++,
         data = {a, a + 2, 3 nx + 4 + a, 3 nx + 3 + b, a + 1, 
           2 nx + 3 + l, 3 nx + 4 + b, 2 nx + 2 + l};
         AppendTo[meshtopology, data];
         a += 2;
         b += 2;
         l += 1;
         ];
        l = 3 nx + 2 + c (i - 1);
        a = 3 nx + 3 + c (i - 1);
        b = 3 nx + 2 + c (i - 1);
        ];
       allcoords = 
        Table[meshnodes[[meshtopology[[i, j]]]], {i, 1, 
          Length[meshtopology]}, {j, 1, Length[meshtopology[[1]]]}];
       {allcoords, meshnodes, meshtopology}
       ];
    
(*Generates graphics to visualize mesh and nodes*)
GenerateGraphics[nodes_, topology_, order_] := 
  Block[{meshvis, nodevis, v}, 
   If[order == 1, v = {1, 2, 3, 4}, v = {1, 5, 2, 6, 3, 7, 4, 8}];
   meshvis = 
    Graphics[{FaceForm[], EdgeForm[Black], 
      GraphicsComplex[nodes, Polygon[topology[[All, v]]]]}];
   (*nodevis=Graphics[{MapIndexed[Text[#2[[1]],#1,{-1,1}]&,
   nodes],{Blue,Point[nodes]}}];*)
   nodevis = 
    Graphics[{MapIndexed[
       Style[Text[#2[[1]], #1, {-1.8, 1.8}], FontSize -> 9] &, 
       nodes], {PointSize[Large], Black, Point[nodes]}}];
   {meshvis, nodevis}
   ];

    L = 5;
    h = 5;
    nx = 2;
    ny = 2;
    order = 2;
    {allcoords, meshnodes, meshtopology} = 
     GenerateGridMesh[L, h, nx, ny, 
      order];(*Generate finite element mesh*)
    {meshvis, nodevis} = 
     GenerateGraphics[meshnodes, meshtopology, 
      order];(*Generates graphics to visualize mesh*)
    Show[meshvis, nodevis, AspectRatio -> Automatic, ImageSize -> Large]

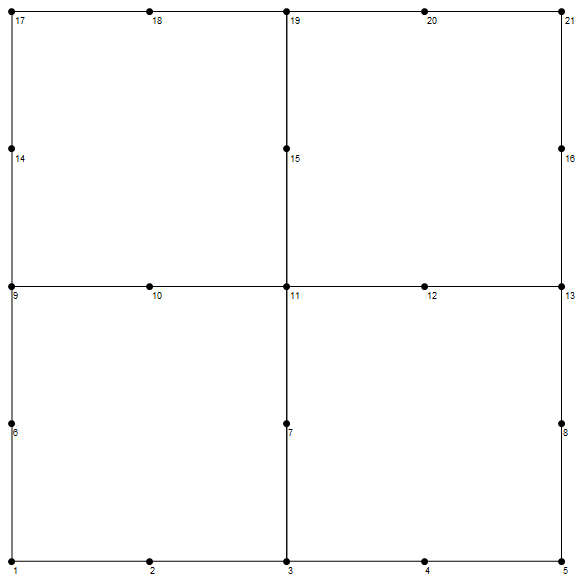
which results in the following mesh:

enter image description here

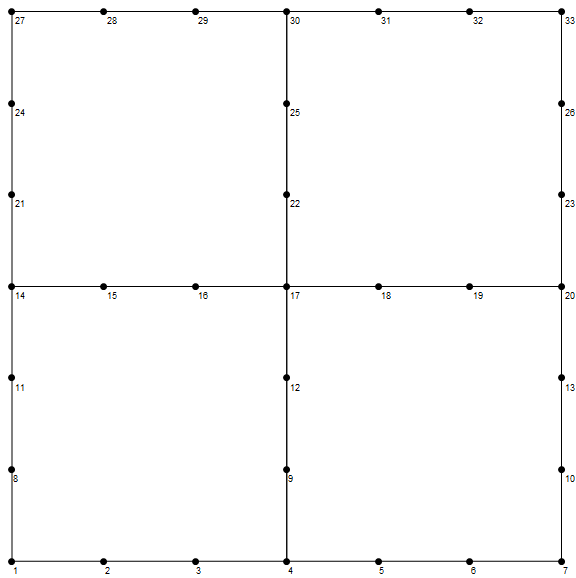
I want to build a generic mesh generator for any polynomial order. Here is an example of what I need:

L = 5;
h = 5;
x = 0;
y = 0;
nx = 2;
ny = 2;
order = 3;
meshnodes = {};
dx = L/(nx order);
dy = h/(ny order);
For[irow = 1, irow <= order nx + 1, irow++,
  For[icol = 1, icol <= order ny + 1, icol++,
   AppendTo[meshnodes, {x, y}];
   If[OddQ[Mod[irow, 3]] == True,
    x += dx ;
    ,
    x += 3 dx ;
    icol += 2;
    ];
   
   ];
  y += dy;
  x = 0;
  ];
meshtopology = {{1, 4, 17, 14, 2, 9, 16, 11, 3, 12, 15, 8}, {4, 7, 20,
     17, 5, 10, 19, 12, 6, 13, 18, 9}, {14, 17, 30, 27, 15, 22, 29, 
    24, 16, 25, 28, 21}, {17, 20, 33, 30, 18, 23, 32, 25, 19, 26, 31, 
    22}};
{meshvis, nodevis} = 
 GenerateGraphics[meshnodes, meshtopology, 
  order];(*Generates graphics to visualize mesh*)
Show[meshvis, nodevis, AspectRatio -> Automatic, ImageSize -> Large]

enter image description here

I need this to be created automatically for any dimensions of L and h, and for any node quantity.

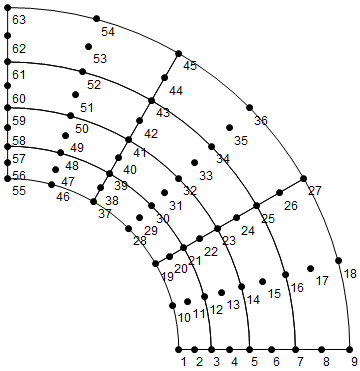
Below is an example of a code that generates a curved mesh (nine noded elements, not serendipity).

GenerateGridMesh[R0_, RE_, nx_, ny_, order_] := 
 Block[{x = 0., y = 0., dx, dy, meshnodes, i, j, meshtopology = {}, 
   allcoords, k, l},
  meshnodes = {};
  k = 0;
  
  (*meshnodes=Flatten[Table[Table[{R Cos[\[Theta]],
  R Sin[\[Theta]]},{R,R0,RE,(RE-R0)/(nx order-2)}],{\[Theta],0,Pi/2,
  Pi/2 /(ny order-2)}],1]//N;*)
  r = (RE/R0)^(1/(-2 + nx order));
  meshnodes = 
   Flatten[Table[
      Table[{ R0 r^(n - 1) Cos[\[Theta]], 
        R0 r^(n - 1) Sin[\[Theta]]}, {n, 1., 
        nx order - 1}], {\[Theta], 0, Pi/2, Pi/2 /(ny order - 2)}], 
     1] // N;
  k = 0;
  For[i = 1 , i < ny, i++,
   l = 1;
   For[j = 1, j < nx, j++,
    (*AppendTo[meshtopology,{j+k,j+2+k,4 nx+j+k,4 nx-2+j+k,j+1+k,j+1+
    nx 2+k,j+nx 4-1+k,2 nx+ j-1+k,2 nx+ j+k}];*)
    AppendTo[
     meshtopology, {l + k, l + 2 + k, 4 nx + l + k, 4 nx - 2 + l + k, 
      l + 1 + k, l + 1 + nx 2 + k, l + nx 4 - 1 + k, 2 nx + l - 1 + k,
       2 nx + l + k}];
    l += 2;
    ];
   k += 4 nx - 2;
   ];
  If[order == 2,
   allcoords = 
     Table[meshnodes[[meshtopology[[i, j]]]], {i, 1, 
       Length[meshtopology]}, {j, 1, 9}];
   ,
   allcoords = 
     Table[meshnodes[[meshtopology[[i, j]]]], {i, 1, 
       Length[meshtopology]}, {j, 1, 4}];
   ];
  {allcoords, meshnodes, meshtopology}
  ]
GenerateGraphics[nodes_, topology_, order_] := 
  Block[{meshvis, nodevis},
   If[order == 2,
    meshvis = 
      Graphics[{FaceForm[], EdgeForm[Blue], 
        GraphicsComplex[nodes, 
         Polygon[topology[[All, {1, 5, 2, 6, 3, 7, 4, 8}]]]]}];
    ,
    meshvis = 
      Graphics[{FaceForm[], EdgeForm[Blue], 
        GraphicsComplex[nodes, 
         Polygon[topology[[All, {1, 2, 3, 4}]]]]}];
    ];
   nodevis = 
    Graphics[{MapIndexed[Text[#2[[1]], #1, {-1, 1}] &, nodes], {Blue, 
       Point[nodes]}}];
   {meshvis, nodevis}
   ];
interpolatingQuadBezierCurve[pts_List] /; Length[pts] == 3 := 
  BezierCurve[{pts[[1]], 1/2 (-pts[[1]] + 4 pts[[2]] - pts[[3]]), 
    pts[[3]]}];
interpolatingQuadBezierCurve[ptslist_List] := 
  interpolatingQuadBezierCurve /@ ptslist;
interpolatingQuadBezierCurveComplex[coords_, indices_] := 
 interpolatingQuadBezierCurve[Map[coords[[#]] &, indices]]
GenerateGraphics[nodes_, topology_] := Block[{meshvis, nodevis},
  nodevis = 
   Graphics[{MapIndexed[
      Style[Text[#2[[1]], #1, {-1.8, 1.8}], FontSize -> 12] &, 
      nodes], {PointSize[Large], Black, Point[nodes]}}];
  Show[nodevis]]
order = 2;
serendipity = False;
{allcoords, nnodes, topol} = GenerateGridMesh[100, 200, 5, 4, order];
linestopology = Flatten[Table[
    {{topol[[i]][[1]], topol[[i]][[5]], topol[[i]][[2]]},
     {topol[[i]][[2]], topol[[i]][[6]], topol[[i]][[3]]},
     {topol[[i]][[3]], topol[[i]][[7]], topol[[i]][[4]]},
     {topol[[i]][[4]], topol[[i]][[8]], topol[[i]][[1]]}
     }, {i, 1, Length[topol]}], 1];
Show[GenerateGraphics[nnodes, topol], 
 Graphics[interpolatingQuadBezierCurveComplex[nnodes, linestopology]],
  ImageSize -> Automatic]

enter image description here

$\endgroup$
13
  • 4
    $\begingroup$ are you aware of the << NDSolveFEM package? reference.wolfram.com/language/FEMDocumentation/ref/… reference.wolfram.com/language/FEMDocumentation/tutorial/… $\endgroup$
    – Mr Puh
    Commented Jul 16, 2020 at 14:13
  • $\begingroup$ Yes, I am aware. But this package creates a maximum of 8 noded elements... $\endgroup$
    – Stratus
    Commented Jul 16, 2020 at 14:19
  • 2
    $\begingroup$ I'd split this in two tasks: First generate a linear quad element mesh, then generate the higher order mesh from that. You might want to add information to you post on how higher order (serendipity) elements look like. $\endgroup$
    – user21
    Commented Jul 16, 2020 at 14:45
  • 2
    $\begingroup$ It's not clear to me from your question if you want a general quad mesh generator (usable for non rectangular regions) or if you just want higher order nodes for quad elements in a rectangular region? $\endgroup$
    – user21
    Commented Jul 20, 2020 at 7:10
  • 1
    $\begingroup$ @CA Trevillian in my opinion it is very dificult. Can you help please? $\endgroup$
    – Stratus
    Commented Jul 21, 2020 at 23:55

1 Answer 1

7
+250
$\begingroup$

I am not sure, if this fully answers your question, but you should be able to work from here. I tried to explain my code with the comments above each for-loop and I maintained your overall structure.

(*Generate Grid Mesh of dimensions axb with nx divisions in x and ny \
divisions in y*)
GenerateGridMesh[aa_, bb_, nx_, ny_, p_] := 
  Block[{x = 0., y = 0., dx, dy, meshnodes = {}, i, j, 
    meshtopology = {}, allcoords, k, topolsz, l, data, c, a, b}, k = 0;
   meshnodes = {};
   (*determine the distance between each node*)
   dx = aa/(p nx);
   dy = bb/(p ny);
   (*Generate node coordinates, 
   meshnodes should contain (p nx+1)(ny+1)+(p \
ny+1)(nx+1)-(nx+1)(ny+1) nodes*)
   For[hl = 0, hl < ny, hl++, (*loop over ny horizontal lines, 
    the last one is done below, after the loop *)
    For[hln = 0, hln < p nx + 1, 
     hln++, (*loop over p nx+1 nodes on the horizontal line*)
     AppendTo[meshnodes, {hln dx, dy p hl}];
     ];
    For[vl = 1, vl <= p - 1, 
     vl++, (*loop over the p-1 horizontal "lines" that are not part \
of the mesh so we can assign the coordinates to the nodes on the \
vertical lines*)
     For[vln = 0, vln < nx + 1, 
       vln++,(*loop over the nx+1 nodes on the vertical lines*)
       AppendTo[meshnodes, {vln p dx , (p hl + vl) dy}];
       ];
     ];
    ];
   (*Now for the last horizontal line, 
   note that we need to set hl to ny, 
   since we started counting from 0:*)
   hl = ny;
   For[hln = 0, hln < p nx + 1, 
    hln++, (*loop over p nx+1 nodes on the horizontal line*)
    AppendTo[meshnodes, {hln dx, dy p hl}];
    ];
   (*generate the list of cells - each cell is a list of node-
   IDs that are on its border.
   We have nx ny cells, each cell has 4p nodes*)
   meshtopology = Table[{}, nx ny];
   (*label the cells (cx,cy), i.e. (0,0),(1,0,1),...,(nx-1,0),(0,
   1),...,(nx-1,ny-1) etc.*)
   For[cy = 0, cy < ny, cy++,
    For[cx = 0, cx < nx, cx++,
      (*bottom edge*)
      For[i = 0, i < p + 1, i++,
       AppendTo[meshtopology[[cx + cy nx + 1]], 
         i + cx p + cy ((nx + 1) (p - 1) + p nx + 1) + 1];
       ];
      (*right edge*)
      For[i = 0, i < p - 1, i++,
       AppendTo[meshtopology[[cx + cy nx + 1]], 
         cx + 1 + i (nx + 1) + (cy + 1) (p nx + 1) + 
          cy (p - 1) (nx + 1) + 1];
       ];
      (*top edge, from right to left*)
      For[i = p, i >= 0, i--,
       AppendTo[meshtopology[[cx + cy nx + 1]], 
         i + cx p + (cy + 1) ((nx + 1) (p - 1) + p nx + 1) + 1];
       ];
      (*left edge,from top to bottom*)
      For[i = p - 2, i >= 0, i--,
       AppendTo[meshtopology[[cx + cy nx + 1]], 
         cx + i (nx + 1) + (cy + 1) (p nx + 1) + 
          cy (p - 1) (nx + 1) + 1];
       ];
      ];
    ];
   allcoords = 
    Table[meshnodes[[meshtopology[[i, j]]]], {i, 1, 
      Length[meshtopology]}, {j, 1, Length[meshtopology[[1]]]}];
   {allcoords, meshnodes, meshtopology}
   ];

(*Generates graphics to visualize mesh and nodes*)
GenerateGraphics[nodes_, topology_, p_] := Block[{meshvis, nodevis, v},
   If[order == 1,
    v = {1, 2, 3, 4},
    v = Table[i, {i, 1, 4 p}];
    ];
   meshvis = 
    Graphics[{FaceForm[], EdgeForm[Black], 
      GraphicsComplex[nodes, Polygon[topology[[All, v]]]]}];
   (*nodevis=Graphics[{MapIndexed[Text[#2[[1]],#1,{-1,1}]&,
   nodes],{Blue,Point[nodes]}}];*)
   nodevis = 
    Graphics[{MapIndexed[
       Style[Text[#2[[1]], #1, {-1.8, 1.8}], FontSize -> 9] &, 
       nodes], {PointSize[Large], Black, Point[nodes]}}];
   {meshvis, nodevis}
   ];

There is really not that much complicated stuff in my solution, I just used some basic for loop indexing wizardry.

When trying to understand my solution, you should note, that I started counting from 0 for all my indices and added 1 at the very end where necessary. This is in part because I am very experienced in C++ (which starts counting from 0 while Mathematica counts from 1), but also because we have many multiplications where it is usefull to have the zeroth row. I recommend making a general sketch of the mesh you want of order $p$ and count the nodes for each horizontal line, for each cell, etc. That way you should arrive at the same equations that I found.

Note, that I changed the ordering of the nodes in each cell. I am going counter-clockwise around the cell, starting at the bottom left corner. I achieved this in part by letting the For-loops for the top and left edge "run backwards".

I am sure that one could work more with Table and similar commands, but since you used For-loops, I did too.

Using the functions like so:

L = 12;
h = 10;
nx = 4;
ny = 5;
order = 6;
{allcoords, meshnodes, meshtopology} = 
 GenerateGridMesh[L, h, nx, ny, 
  order];(*Generate finite element mesh*){meshvis, nodevis} = 
 GenerateGraphics[meshnodes, meshtopology, 
  order];(*Generates graphics to visualize mesh*)Show[meshvis, \
nodevis, AspectRatio -> Automatic, ImageSize -> Large]

yields the following image

Mesh for nx=4,ny=5,order=6

I am also not sure, what you meant with the dimensionality of L and h, but since your examples are all 2-D meshes, I assumed that they are only lengths (and hence have basically no influence on the mesh apart from the distance between the nodes).

$\endgroup$
3
  • $\begingroup$ this is what I needed. Thank you. I think this is of interest of the hole FEM community. I will accept your answer. :) $\endgroup$
    – Stratus
    Commented Jul 23, 2020 at 19:01
  • $\begingroup$ The topology should be enumerated first by the corners..but I think I can solve this changing the shape functions orders. $\endgroup$
    – Stratus
    Commented Jul 23, 2020 at 19:02
  • $\begingroup$ Or you could take the four nodes out of the for-loops for the top and bottom edge, they are the first and last node of those edges, and put them before all other Appendto[meshtopology] :-) $\endgroup$
    – Andrea
    Commented Jul 24, 2020 at 9:56

Your Answer

By clicking “Post Your Answer”, you agree to our terms of service and acknowledge you have read our privacy policy.

Not the answer you're looking for? Browse other questions tagged or ask your own question.