7
$\begingroup$

I have a dynamic graph which changes depending on the current selection from a drop down box. All selections from the drop down box give fine results except one. For the one selection it shows the y axis in scientific notation. I understand that this is due to the values being large but I don't want this to happen. I also can't specify the y axis values manually, I need to use the FrameTicks->Automatic functionality. Is there any way to stop the y-axis ticks from displaying in scientific notation?

enter image description here

$\endgroup$
5

2 Answers 2

5
$\begingroup$

This is definitely possible but you will need to define your own FrameTicks function. Fortunately you can do this with a defined auxiliary function.

You can use the information in the answers to this question to develop a custom tick function.

This answer provides some ideas about how to define a different format for your ticks.

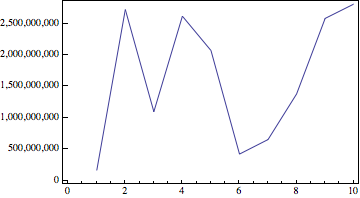
You don't provide sample data, but here is an example which fits:

fakedata = RandomReal[{1*10^6, 3*10^9}, 10];

niceticks[min_, max_] := {#, NumberForm[#, DigitBlock -> 3], {0.02, 0}} & /@ 
  FindDivisions[{min, max}, 6]

ListLinePlot[fakedata, Frame -> True, 
 FrameTicks -> {{niceticks, None}, {Automatic, None}}]
enter image description here

This approach will allow you to specify nice ticks for any data range, without knowing in advance what that range might be.

Given you have a very stretched AspectRatio, you will need a smaller number for the tick length: the number is a fraction of the plot width.

niceticks[min_, max_] := {#, NumberForm[#, DigitBlock -> 3], {0.01, 0}} & /@ 
  FindDivisions[{min, max}, 6]

Getting the x-ticks you want requires a similar approach, but the custom function can be simpler:

tickateveryinteger[min_, max_] := Range[Floor[min], Ceiling[max]]

Resulting in:

ListLinePlot[fakedata, Frame -> {{True, False}, {True, False}}, 
 FrameTicks -> {{niceticks, None}, {tickateveryinteger, None}}, 
 AspectRatio -> 1/5]

enter image description here

$\endgroup$
5
  • $\begingroup$ This is close, but when I use this how do I specify the range for the x axis ticks ? I need to see all the numbers and not just multiples of 2 on the x axis. Also, when I use this the tick marks on the y axis are stretched with my graph and look terrible. $\endgroup$
    – lara
    Commented Apr 3, 2013 at 11:00
  • $\begingroup$ Ok, I will edit for somethimg more precise. The issue with the tick length occurs because they are specified as fractions of the plot length. $\endgroup$
    – Verbeia
    Commented Apr 3, 2013 at 11:03
  • $\begingroup$ I found out about the x axis problem, now it's just the problem of getting rid of the long ticks on the y axis. $\endgroup$
    – lara
    Commented Apr 3, 2013 at 11:08
  • $\begingroup$ Lara, see my edit $\endgroup$
    – Verbeia
    Commented Apr 3, 2013 at 11:10
  • $\begingroup$ That works fine for the one graph but not too great when I choose one of the other drop down options and the graph displays something else. Is there not a way (perhaps with OptionInspector) to make sure Mathematica NEVER uses scientific notation anywhere at all? $\endgroup$
    – lara
    Commented Apr 3, 2013 at 11:53
3
$\begingroup$

Does this work for you?

data = {#, # + 10^7} &@Table[2.5 10^8 + RandomInteger[10^8], {8}];

g = ListLinePlot[data, Axes -> False, 
   Frame -> {{True, False}, {True, False}}];
newticks = 
  AbsoluteOptions[g, 
    FrameTicks] /. {x_Real, x_, y__} :> {x, AccountingForm[x], y};

Show[g, newticks, AspectRatio -> 1/5]

The above changes all ticks to AccountingForm, which doesn't seem to matter for your example. If you want just the y axis reformatted, then the following works:

newticks = 
  FrameTicks -> 
   MapAt[# /. {x_Real, x_, y__} :> {x, AccountingForm[x], y} &, 
    FrameTicks /. AbsoluteOptions[g, FrameTicks], 2];
Show[g, newticks, AspectRatio -> 1/5]

Note: The documentation indicates that FrameTicks should have the structure {{left, right}, {bottom, top}} but AbsoluteOptions[g, FrameTicks] returns {bottom, left, top, right}. It seems to be an undocumented alternative.

Mathematica graphics

$\endgroup$

Your Answer

By clicking “Post Your Answer”, you agree to our terms of service and acknowledge you have read our privacy policy.

Not the answer you're looking for? Browse other questions tagged or ask your own question.