3
$\begingroup$

Huge thanks to those who have helped me find my footing especially to @bRost03 who did the programming below.

I hope you guys don't mind if I clarify one thing about the programming - I think I have sorted most of it out and it is a very short query!

Below is the code from my Mathematica terminal:

data = {{{20., 25., 55.,}, {35., 25., 40.,}, {10., 15., 75.,}, {5., 50., 45.,}, {25., 65., 10.,}, {55., 25., 20.,}}}
toGrid[p_] := 1/2 {2 p[[2]] + p[[3]], Sqrt[3] p[[3]]};
dataPts = {10 toGrid[Most@#], Last@#} & /@ data;
pts3D = Select[Tuples[Range[0, 10], {3}], #[[1]] + #[[2]] + #[[3]] == 10 &];
pts = toGrid /@ pts3D;
ptsG = Table[toGrid /@ Select[pts3D, #[[i]] == 0 &], {i, 3}];
lines = {Thread[{ptsG[[1]], ptsG[[2]]}], 
   Thread[{ptsG[[2]], ptsG[[3]]}], 
   Thread[{ptsG[[1]], Reverse[ptsG[[3]]]}]};
st[sz_] := Style[#, Black, Bold, FontFamily -> "Times", sz] &;
rot = 60 Degree;
ticks = st[12] /@ Table[10 i, {i, 0, 10}];
labels = {Rotate[Text[st[16]["Carbs"], {1.5, 5}], rot],
   Text[st[16]["Fats"], {5, -1}],
   Rotate[Text[st[16]["Protein"], {8.5, 5}], -rot]};
mkTicks[ind_, ang_, off_] := Table[
Rotate[Text[If[ind == 2, Reverse[ticks], ticks][[i]], 
    ptsG[[ind, i]] + off], ang], {i, Length[ticks]}]

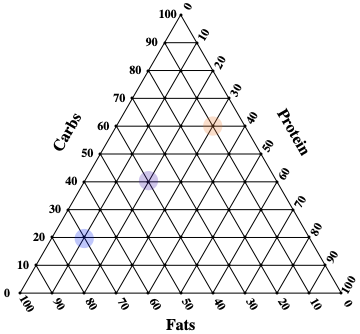
As you can see, my sample data is shown, with the set of three numbers being my percentage of each nutrient (in the order Protein, Fat, Carbohydrate) 1)How do I let Mathematica know which number is which?

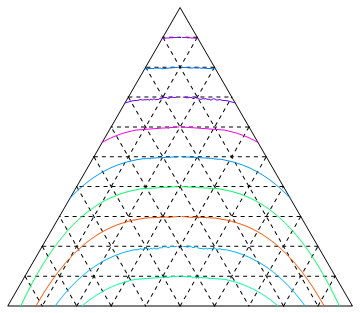
The only other thing was about the colour... If you look at the second picture - how can I tell Mathematica to assign a colour to different sleeping hours (a fourth value not included in the picture) with the following divisions:

7.9 = red, 8.15 being blue and 8.7 being red, with the in-between values a proportional blend of these three?

I think I want something like this:

Graphics[{Point /@ pts, labels, Line /@ lines, mkTicks[1, rot, {1/4, 1/4}],
 mkTicks[2, 0, {-2/5, 0}], mkTicks[3, -rot, {1/5,-1/3}], Opacity[0.25],
 {FaceForm@Blend[{Red, Blue,Green}, #[[-1]]], Disk[#[[1]], 0.2]} & /@ dataPts}]

But the code above is for the following divisions: red is for 0, blue is for 1/2 and green is for 1

Many many thanks for ALL help! I am eternally grateful

$\endgroup$
2
  • $\begingroup$ Editing - many thanks @HighPerformanceMark $\endgroup$
    – Rushi
    Commented Jun 2, 2020 at 11:44
  • $\begingroup$ can you add the missing fourth column values in data? $\endgroup$
    – kglr
    Commented Jun 7, 2020 at 9:30

2 Answers 2

2
$\begingroup$

Your concept works nice:

Graphics[{Point /@ pts, labels, Line /@ lines, 
  mkTicks[1, rot, {1/4, 1/4}], mkTicks[2, 0, {-2/5, 0}], 
  mkTicks[3, -rot, {1/5, -1/3}], Opacity[0.25]}]

2d graphics mix plot

The rest is a big misconeption.

a) This is 2D-Graphics. b) Disk is a 2D-Graphics-built-in: Disk[{x,y},r] c) x and y are the only coordinates in contrast to the three coordinates in dataPts. d) FaceForm is not needed to color a Disk. e) Blend suffices for coloring. f) The set of data in dataPts appear inconsistent for purposes. g) The is no clue which of the coordinate are targeted for coloring.

A functioning example without map:

Graphics[{Point /@ pts, labels, Line /@ lines, 
  mkTicks[1, rot, {1/4, 1/4}], mkTicks[2, 0, {-2/5, 0}], 
  mkTicks[3, -rot, {1/5, -1/3}], 
  Opacity[0.25], {Blend[{{7.9, Blue}, {8.15, Yellow}, {8.7, Red}}, 7],
    Disk[{2, 1.7}, 0.3], 
   Blend[{{3.9, Blue}, {7.15, Yellow}, {8.7, Red}}, 8], 
   Disk[{6, 5.2}, 0.3], 
   Blend[{{7.9, Blue}, {8.15, Yellow}, {4.7, Red}}, 7], 
   Disk[{4, 3.5}, 0.3]}}]

2d graphics mix plot

a) The 3D coordinates have to be mapped appropriately into the mixing triangle. b) The coloring has to set accordingly.

Have a look at stackexchange.com with the search feature and select your best fit for the mixing graphics from the existing examples in the question.

Have a look at:

how-to-plot-ternary-density-plots how-can-i-draw-ternary-plot-by-these-data how-to-conveniently-plot-3-category-dirichlet-data-in-equilateral-triangle-inste

constructing-a-ternary-histogram

how-to-plot-curves-in-ternary-plot-triangular-plot

 tercp[cp_Graphics] :=
    Quiet@Cases[ Normal@First@Cases[cp, _GraphicsComplex, Infinity] ,
        Line[x_] :> Line[{
           1 - #[[1]] + #[[2]],
           Sqrt[3] (1 - #[[1]] - #[[2]])}/2 & /@
             Select[x, Total[#] <= 1 &] ], Infinity] 

 Graphics[{Line[{{0, 0}, {1, 0}, {1/2, Sqrt[3]/2}, {0, 0}}],
         {Dashed,
Table[ tercp [ ContourPlot[(1 - b - a) == ci , {a, 0, 1}, {b, 0, 1}] ],{ci, .1, .9, .1}],
Table[tercp [ ContourPlot[a == ci , {a, 0, 1}, {b, 0, 1}] ], {ci, .1, .9, .1}],
Table[ tercp [ ContourPlot[b == ci , {a, 0, 1}, {b, 0, 1}] ] , {ci, .1, .9, .1}]},
Table[ {Hue[RandomReal[]], 
   tercp [ ContourPlot[Abs[b - a] == (sig - 2 (1 - b - a) + 1)^.35,
       {a, 0, 1}, {b, 0, 1}] ] }, {sig, -1, 1, .2}]}]

2d graphics plot ternary mixing

$\endgroup$
0
$\begingroup$

Use the form Blend[{{x1, color1}, {x2, color2}, {x3, color3},...}, x] to get colori when x == xi:

blend = Blend[{{7.9, Red}, {8.15, Yellow}, {8.7, Red}}, #] &;

GraphicsGrid[Partition[
 Table[Graphics[{blend[x], Rectangle[], Black, Text[Style[x, 14], {1, 1}/2]}],
       {x, 7.55, 9, .05}],
   10]]

enter image description here

$\endgroup$
1
  • $\begingroup$ Thanks - but I did want it in a ternary plot - I have done that above - could I combine the two? $\endgroup$
    – Rushi
    Commented Jun 2, 2020 at 16:08

Your Answer

By clicking “Post Your Answer”, you agree to our terms of service and acknowledge you have read our privacy policy.

Not the answer you're looking for? Browse other questions tagged or ask your own question.