0
$\begingroup$

In my recent answer to How can one expand an arbitrary boolean combination into the $2^n$ atoms of the associated boolean algebra of size $2^{2^n}$?, for the eight atoms

{G[0],G[1],G[2],G[3],G[4],G[5],G[6],G[7]}}= {A && B && C, ! A && B && C, A && ! B && C, A && B && ! C, ! A && ! B && C, ! A && B && ! C, A && ! B && ! C, ! A && ! B && ! C}

of the 256-dimensional Boolean algebra {A,B,C}, I gave the formulas

{G[0] -> 2/121, G[1] -> (4 (-1311 + 242 Sqrt[3] \[Pi]))/9801,  G[2] -> -1/(12741300 Log[9]) (6370650 Sqrt[3] Log[2] - 1572357 Log[9] - 629200 Sqrt[3] \[Pi] Log[9] + 78650 Sqrt[3] Log[9] Log[97 + 56 Sqrt[3]]), G[3] -> -((26325 Sqrt[3] Log[2] - 47454 Log[9] + 2600 Sqrt[3] \[Pi] Log[9] - 325 Sqrt[3] Log[9] Log[97 + 56 Sqrt[3]])/(52650 Log[9])), G[4] -> -1/(12741300 Log[9]) (-6370650 Sqrt[3] Log[2] - 5034243 Log[9] + 629200 Sqrt[3] \[Pi] Log[9] - 78650 Sqrt[3] Log[9] Log[97 + 56 Sqrt[3]]), G[5] -> -((-26325 Sqrt[3] Log[2] + 2604 Log[9] + 2600 Sqrt[3] \[Pi] Log[9] - 325 Sqrt[3] Log[9] Log[97 + 56 Sqrt[3]])/(52650 Log[9])), G[6] -> -1/( 6370650 Log[9]) (-3185325 Sqrt[3] Log[2] - 420384 Log[9] + 314600 Sqrt[3] \[Pi] Log[9] + 39325 Sqrt[3] Log[9] Log[97 + 56 Sqrt[3]]), G[7] -> -(1/(6370650 Log[9])) (3185325 Sqrt[3] Log[2] - 523416 Log[9]-314600 Sqrt[3] \[Pi] Log[9] + 
 39325 Sqrt[3] Log[9] Log[97 + 56 Sqrt[3]])}

or, approximately,

{G[0] -> 0.01652892561983471, G[1] -> 0.002374589708822430, G[2] -> 0.06259481828891220,G[3] -> 0.4157208527407065,  G[4] -> 0.4559237002296063, G[5] -> 0.01135281656781356, G[6] -> 0.01415526980118329, G[7] -> 0.02134902704312096}

(The sum of these eight equals 1.)

Can one construct a Venn diagram https://mathworld.wolfram.com/VennDiagram.html (or other graphic representation) faithfully (or as "best as possible") depicting the relations between the three sets?

To further emphasize the "best as possible" remark, I am essentially initially asking here for a two-dimensional/planar representation of the (boolean) relations between the three sets.

However, actually, the three sets, in fact, all sit in a three-dimensional space/cube {Q1,Q2,Q3} $\in [0,1]^3$, with the (tetrahedral, I've been told) constraint,

 Q1 > 0 && Q2 > 0 && Q3 > 0 && Q1 + 3 Q2 + 2 Q3 < 1  .

Now, A satisfies the further constraint,

(65536 (Q1 - Q3)^12 (1 - 9 Q2 - 6 Q3 + 
3 (Q1^2 + 9 Q2^2 + 6 Q2 Q3 + 4 Q3^2 + 
   Q1 (-1 + 3 Q2 + 4 Q3)))^2)/43046721 > (2^(28)/(3^(16) 7^(14)))/1638

B, the further constraint,

(4 Sqrt[(Q1 - Q3)^2] + 
4/3 Sqrt[
 1 - 9 Q2 - 6 Q3 + 
  3 (Q1^2 + 9 Q2^2 + 6 Q2 Q3 + 4 Q3^2 + 
     Q1 (-1 + 3 Q2 + 4 Q3))])^2 > 16/9

and C, the further constraint,

 Q1^2 + 3 Q1 Q2 + (3 Q2 + Q3)^2 < 3 Q2 + 2 Q1 Q3

So, possibly one must rely upon RegionPlot3D for a faithful representation. That being the case, how can best can one portray the relations among the sets? There are disconnections/non-contiguities--so any faithful representation might be quite "messy".

$\endgroup$
4
  • $\begingroup$ Could you simplify the question to a minimal working example representing the problem in its simplest form? It seems to me that many of the details about the origin of the problem only cloud the issue at hand. For instance, I have no idea what the constraints should mean, and which quantities you are trying to represent. $\endgroup$
    – MarcoB
    Commented May 21, 2020 at 22:07
  • $\begingroup$ I wonder if any of the techniques shown here would help: Improved Visualization Labeling: Venn Diagram $\endgroup$
    – MarcoB
    Commented May 21, 2020 at 22:09
  • $\begingroup$ Well, to begin with, I ask the question based solely on the knowledge of the eight atoms--without regard to the origin/nature of the sets themselves, and ask for a diagram based solely on that "atomic" information. Then, as background, I explain that the three sets (A, B, C), in question, are, in fact, those points in 3D-space satisfying the given constraints. With this further information, RegionPlot3D seems appropriate, and I have since found some interesting plots using this command. (In that case, knowledge of the atoms themselves seems irrelevant.) So, what can be done without using it? $\endgroup$ Commented May 22, 2020 at 3:40
  • $\begingroup$ I looked at wolfram.com/language/12/improved-visualization-labeling/… Certainly interesting, but I don't see how to apply it to my 3D sets, since only standard figures like Disk seem to be used. Maybe the methods could be successfully applied in this case, but I clearly don't see how to accomplish that. $\endgroup$ Commented May 22, 2020 at 3:45

1 Answer 1

1
$\begingroup$

This appears to accomplish the essential goals I had in mind.

First, we take the code that user250938 provided in his answer to How can one expand an arbitrary boolean combination into the $2^n$ atoms of the associated boolean algebra of size $2^{2^n}$? , that is

F[0] = And[a, b, c];F[1] = And[Not[a], b, c];F[2] = And[Not[b], a, c];F[3] = And[Not[c], a, b];F[4] = And[Not[a], Not[b], c];F[5] = And[Not[a], Not[c], b];F[6] = And[Not[c], Not[b], a];F[7] = And[Not[c], Not[b], Not[a]];S = And[c, Or[a, b]];sum = 0;For[i = 0, i <= 7, i = i + 1, If[TautologyQ[Implies[F[i], S]], sum=sum + G[i]]]sum

Then, we take (constraints a and b are--equivalently, for the purposes at hand--the "square roots" of the constraints A and B in the question),

c =  Q1^2 + 3 Q1 Q2 + (3 Q2 + Q3)^2 < 3 Q2 + 2 Q1 Q3

and

a = (256 (Q1 - Q3)^6 (1 - 9 Q2 - 6 Q3 + 
 3 (Q1^2 + 9 Q2^2 + 6 Q2 Q3 + 4 Q3^2 + Q1 (-1 + 3 Q2 + 4 Q3))))/6561 > (8192 Sqrt[2/91])/16209796869

and

 b= 4 Sqrt[(Q1 - Q3)^2] + 4/3 Sqrt[1 - 9 Q2 - 6 Q3 + 
 3 (Q1^2 + 9 Q2^2 + 6 Q2 Q3 + 4 Q3^2 + Q1 (-1 + 3 Q2 + 4 Q3))] > 4/3

as well as

d = Q1 > 0 && Q2 > 0 && Q3 > 0 && Q1 + 3 Q2 + 2 Q3 < 1

Now, the command

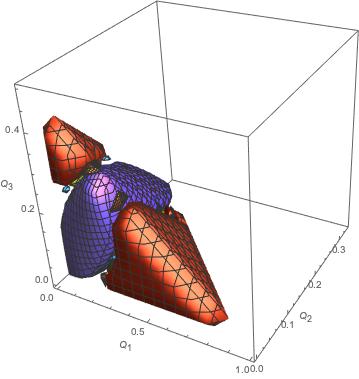
Do[G[i] = F[i] && d, {i, 0, 7}]; RegionPlot3D[{G[0], G[1], G[2], G[3], G[4], G[5], G[6], G[7]}, {Q1, 0, 1}, {Q2, 0, 1/3 }, {Q3, 0, 1/2}, AxesLabel -> {Subscript[Q, 1], Subscript[Q, 2], Subscript[Q, 3]}]

yields

enter image description here

So, this is, in some sense, a three-dimensional Venn diagram--while, as I noted, I do not believe it would be possible to create a conventional (2D) diagram, faithfully giving the relations between the eight sets/atoms.

Further, how might I "polish" this plot further (for possible journal/arXiv publication)--including labels for the eight sets displayed, choice of colorings...?

As further information, let us mention as reported in the last answer to How can one expand an arbitrary boolean combination into the $2^n$ atoms of the associated boolean algebra of size $2^{2^n}$? that the measures/probabilities assigned to the eight atoms/sets are--in the indicated order (G[0] G2,...)-- $\left\{\frac{2}{121},\frac{4 \left(242 \sqrt{3} \pi -1311\right)}{9801},\frac{524119}{4247100}+\frac{4 \pi }{27 \sqrt{3}}-\frac{\sqrt{3} \log (2)}{\log (81)}-\frac{\cosh ^{-1}(97)}{54 \sqrt{3}},\frac{7909}{8775}-\frac{4 \pi }{27 \sqrt{3}}-\frac{\sqrt{3} \log (2)}{\log (81)}+\frac{\cosh ^{-1}(97)}{54 \sqrt{3}},\frac{1678081}{4247100}-\frac{4 \pi }{27 \sqrt{3}}+\frac{\sqrt{3} \log (2)}{\log (81)}+\frac{\cosh ^{-1}(97)}{54 \sqrt{3}},-\frac{434}{8775}-\frac{4 \pi }{27 \sqrt{3}}+\frac{\sqrt{3} \log (2)}{\log (81)}+\frac{\cosh ^{-1}(97)}{54 \sqrt{3}},\frac{70064}{1061775}-\frac{4 \pi }{27 \sqrt{3}}+\frac{\sqrt{3} \log (2)}{\log (81)}-\frac{\cosh ^{-1}(97)}{54 \sqrt{3}},\frac{87236}{1061775}+\frac{4 \pi }{27 \sqrt{3}}-\frac{\sqrt{3} \log (2)}{\log (81)}-\frac{\cosh ^{-1}(97)}{54 \sqrt{3}}\right\} \approx \{0.01652892562,0.002374589709,0.06259481829,0.4157208527,0.4559237002,0.01135281657,0.0 1415526980,0.02134902704\}$.

So, atoms with small probability may be difficult to effectively label.

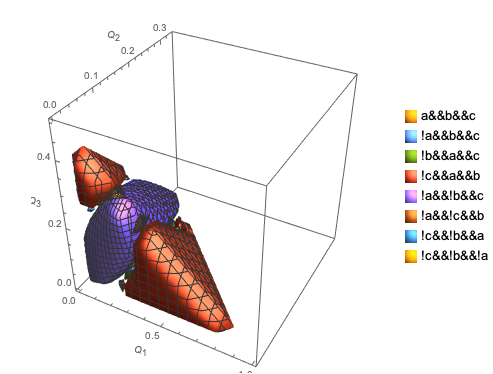
When I employ the option

PlotLegends -> {"a&&b&&c", "!a&&b&&c", "!b&&a&&c", "!c&&a&&b", "!a&&!b&&c", "!a&&!c&&b", "!c&&!b&&a", "!c&&!b&&!a"}

the result is

enter image description here

$\endgroup$

Your Answer

By clicking “Post Your Answer”, you agree to our terms of service and acknowledge you have read our privacy policy.

Not the answer you're looking for? Browse other questions tagged or ask your own question.