4
$\begingroup$

Say, I have a function f[t] defined in my notebook. I can find it's maximum value using FindMaximum. Say that it's maximum value is 10^5. How do I get it's next maxima which is not greater than 10^4?

One way to get the n-th maxima is as follows :

listFunc = Table[Func[t], {t, 1, 10, 1}]
RankedMax[listFunc, 2] (* for second maxima *)

This can generate maxima just fine but this has two shortcomings.

i) I cannot choose the tolerance on my maxima i.e. suppose there is a maxima which is shy of the first maximum by just a value of 5 and I might not want that. I might want to set a tolerance of 100 so that only a value which is short by, atleast, 100 of the maximum will be registered as a maxima.

ii) The Table will evaluate each and every point in the list. It is possible to have a case, as I do, when FindMaximum gives me a result in less than 5 seconds when generating the data for Table takes upto 8 hours or so.

How to get the desired result quickly in such a case?

$\endgroup$
5
  • 2
    $\begingroup$ Could use some of the methods from this older MSE post to collect local maxima, then just selct what you want based on criteria. $\endgroup$ Commented May 9, 2020 at 21:30
  • 1
    $\begingroup$ @DanielLichtblau Actually, I looked at that post before posting. The problem again is with the time taken. To generate the plot I would need to run my notebook for around 8 hours which unfortunately defeats my purpose. I used FindMaximum as it reduces those 8 hours to just 5 seconds! $\endgroup$
    – Nitin
    Commented May 9, 2020 at 21:38
  • 1
    $\begingroup$ I’m surprised that the Table takes so long when FindMaximum doesn’t, but it’s hard to help without knowing what the function is. $\endgroup$
    – Chris K
    Commented May 10, 2020 at 1:37
  • $\begingroup$ @ChrisK My function is actually a function of functions which themselves are same and this all amounts to around 10 pages of code. So I have to provide a sample example to get my answer. Also, what Table is doing is that it's calculating the value of my function around 10000 times which involves a lot of computation but FindMaximum must be using some numerical algorithm to give me just one value which happens to be maximum. Shouldn't be too hard. $\endgroup$
    – Nitin
    Commented May 10, 2020 at 1:49
  • $\begingroup$ The problem with functions that have problems is that it is unusual and there must be something about the function that causes the problem. But no indication what the problem could be is given. Is the function smooth? Does it have a symbolic derivative? Are there singularities? Weak singularities? Are there numerical issues in evaluating the function (e.g.some high degree polynomials)? -- BTW, FindMaximum finds a local maximum. How do you know it has found the largest maximum? $\endgroup$
    – Michael E2
    Commented May 10, 2020 at 15:43

2 Answers 2

3
$\begingroup$

I was going to post this method as an answer to the Q&A Daniel linked, How to find all the local minima/maxima in a range, but it doesn't work very well on interpolated data. If the function is fairly smooth, then this will work nicely. The method is based on Boyd's CPR method (see also this answer by J.M.). It borrows code from two of my answers, here and here. The basic idea is to approximate a function by an interpolating polynomial and use the fact that the roots of the polynomial are the eigenvalues of a companion matrix to solve an equation. In Boyd's method, we use a Chebyshev interpolation and the companion matrix is often called the "colleague matrix."

We will apply the method to the derivative of the function, which is assumed to exist. Another requirement is that the search interval be finite. In the OP, the example Table suggests that it is finite and equal to $[1,10]$.

Using @kglr's example:

ClearAll[ff]
ff[x_] := 20 + Sin[x] + Cos[6 x]/2 - (4 - x/5)^2;

{aa, bb} = {1, 10}; (* interval over which to approximate *)
{aa, 
   bb} = {0, 
   40}; (* interval over which to approximate *)
nn = 256; (* needs to be somewhat larger than twice the number of critical points *)
tt =
  Sin[Pi/2 Range[N@nn, -nn, -2]/nn];
xx = Rescale[tt, {-1, 1}, {aa, bb}];
yy = ff /@ xx;
cc = Sqrt[2/nn] FourierDCT[yy, 1];
cc[[{1, -1}]] /= 2;

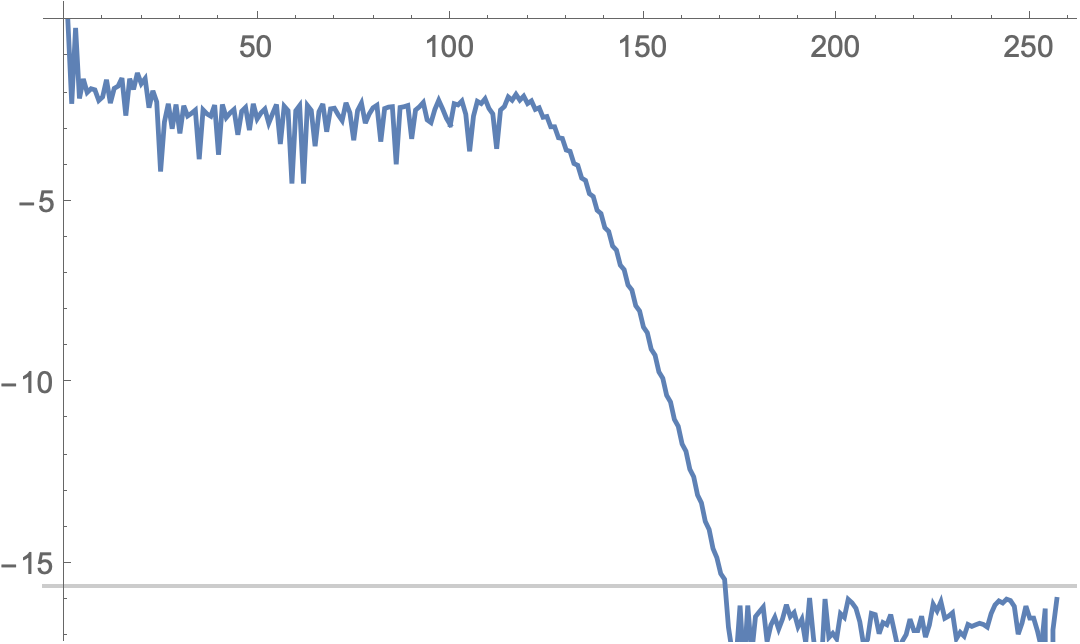
The tail of the Chebyshev coefficient sequence cc give an estimate of the error of the approximation since the Chebyshev polynomials satisfy $|T_j(x)| \le 1$. The plot shows that convergence starts around degree 120 and reaches machine precision around 170.

ListLinePlot[cc/Max@Abs@cc // RealExponent, 
 GridLines -> {None, {RealExponent@$MachineEpsilon}}, 
 PlotRange -> {RealExponent@$MachineEpsilon - 1.5, 0.5}]
enter image description here

We calculate how many terms to drop as follows:

(* trim the Chebyshev coefficients *)
Module[{sum = 0.}, 
 LengthWhile[Reverse@Abs[cc]/Max@Abs@cc, (sum += #) < 0.5*^-14 &]]
cc = Drop[cc, 1 - %];
Length@cc
(*
  88
  170
*)

The critical points may be found by finding the zeros of the derivative of the Cheybshev series, by finding the eigenvalues of its colleague matrix. The eigenvalues will contain roots outside the real interval {aa, bb}, including complex roots; but outside the interval, the Chebyshev series no longer approximates ff[x], so they are discarded.

eigs = Eigenvalues@  (*eigenvals of matrix contain the roots*)
  colleagueMatrix[
   dCheb[cc]];       (*Chebyshev series of the derivative*)
cps = Sort@Rescale[  (*select crit.pts. in [-1,1] and*)
   Re@Select[        (*rescale to [aa,bb]*)
     eigs, 
     Abs[Im[#]] < 1*^-15 && -1.0001 < Re[#] < 1.0001 &]
   , {-1, 1}
   , {aa, bb}];

Plot[ff[x], {x, aa, bb}, 
 Epilog -> {Red, PointSize@Medium, 
   Point@Transpose@{cps, ff /@ cps}}]
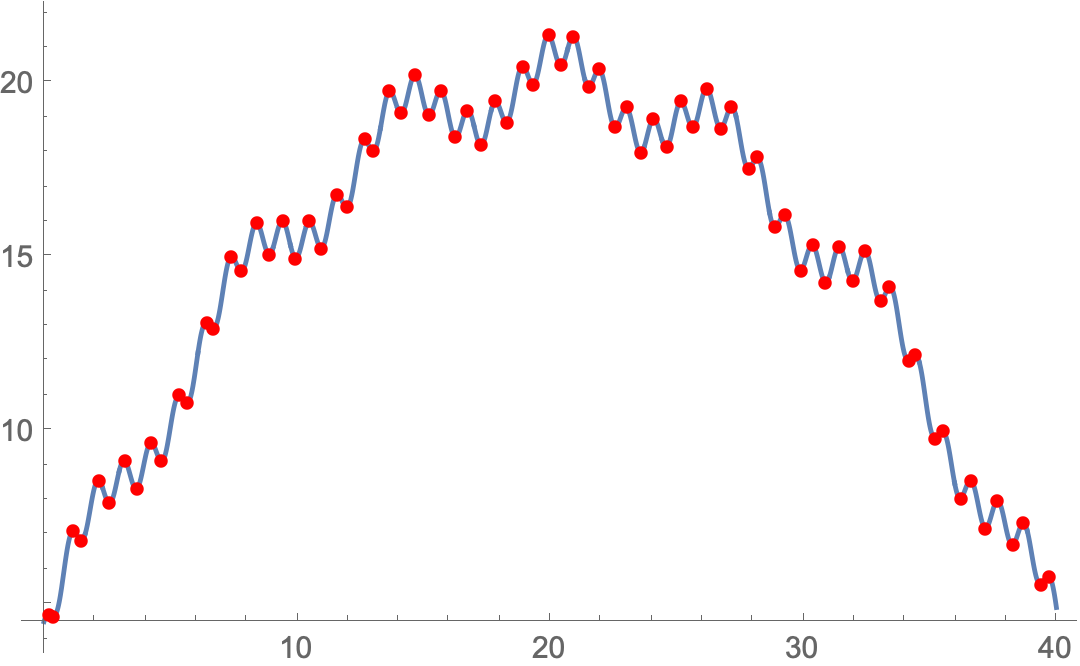
enter image description here

(* the extrema gathered by type *)
extr = Merge[Thread[cpType@*fpp /@ cps -> cps], Identity]
(*
<|"Max" -> {0.171632, 1.16184, 2.14435, 3.16093, 4.23382, 5.3405, 
   6.41079, 7.41341, 8.40034, 9.41626, 10.4872, 11.5897, 12.659, 
   13.6678, 14.6569, 15.6714, 16.7412, 17.842, 18.9112, 19.9237, 
   20.9134, 21.9255, 22.9947, 24.0956, 25.1655, 26.1802, 27.1692, 
   28.1773, 29.2466, 30.3495, 31.4207, 32.4368, 33.4233, 34.4247, 
   35.4953, 36.6028, 37.676, 38.6926, 39.6743}, 
 "Min" -> {0.358639, 1.47877, 2.58769, 3.64117, 4.6461, 5.64167, 
   6.68628, 7.79527, 8.89992, 9.95174, 10.9572, 11.9578, 13.0049, 
   14.1093, 15.2121, 16.2624, 17.2672, 18.2708, 19.3197, 20.4223, 
   21.5251, 22.5738, 23.577, 24.582, 25.6325, 26.7354, 27.8402, 
   28.8871, 29.8872, 30.8926, 31.9446, 33.0497, 34.1597, 35.2038, 
   36.1985, 37.2032, 38.257, 39.3667}|>
*)

extr["Max"]
(*  {0.171632, 1.16184,..., 39.6743}  *)

tol = 5; (* minimum gap between values of maxima *)
culledcps = First /@ First@FixedPoint[
    With[{m = 
        Replace[#[[2]], {{} -> Nothing, 
          e_ :> Nearest[e[[All, 2]] -> e, e[[1, 2]], {All, tol}]}]},
      {Join[#[[1]], {m}], Drop[#[[2]], Length@m]}
      ] &,
    {{}, SortBy[Transpose@{#, ff /@ #} &@extr["Max"], -Last[#] &]},
    Length@extr["Max"]]
(*
  {{19.9237, 21.3724}, {29.2466, 16.2042},
   {5.3405, 10.9997}, {39.6743, 5.81369}}
*)

Plot[ff[x], {x, aa, bb}, 
 Epilog -> {Red, PointSize@Medium, Point@culledcps}]    
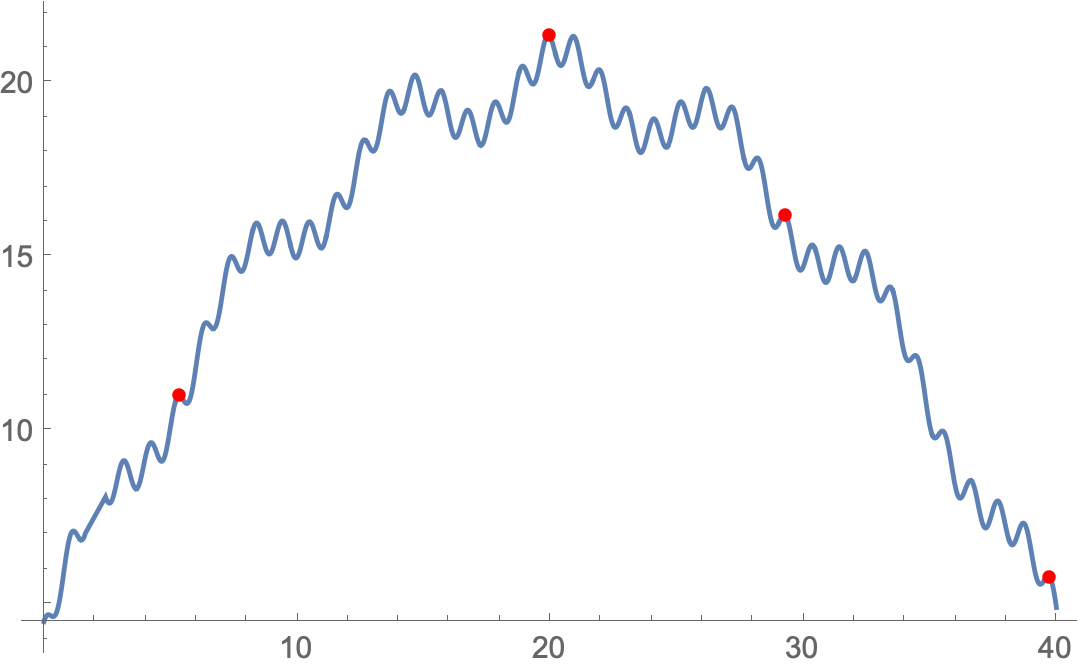
enter image description here

Utility code dump

(*Differentiate a Chebyshev series*)
(*Recurrence:$2 r c_r=c'_{r-1}-c'_{r+1}$*)
ClearAll[dCheb];
dCheb::usage = 
  "dCheb[c, {a,b}] differentiates the Chebyshev series c scaled over \
the interval {a,b}";
dCheb[c_] := dCheb[c, {-1, 1}];
dCheb[c_, {a_, b_}] := 
  Module[{c1 = 0, c2 = 0, c3}, 
   2/(b - a) MapAt[#/2 &, Reverse@Table[c3 = c2;
       c2 = c1;
       c1 = 2 (n + 1)*c[[n + 2]] + c3, {n, Length[c] - 2, 0, -1}], 1]];

(*"Chebyshev companion matrix" (Boyd,2014)/"Colleague matrix" (Good,1961)*)
ClearAll[colleagueMatrix];
colleagueMatrix[cc_] := 
  With[{n = Length[cc] - 1}, 
   SparseArray[{{i_, j_} /; i == j + 1 :> 
       1/2, {i_, j_} /; i + 1 == j :> 1/(2 - Boole[i == 1])}, {n, 
      n}] - SparseArray[{{n, i_} :> cc[[i]]/(2 cc[[n + 1]])}, {n, 
      n}]];

ClearAll[cpType];
(* critical point type *)
cpType[_?Negative] := "Max";
cpType[_?Positive] := "Min";
cpType[dd_ /; dd == 0] := Indeterminate;
$\endgroup$
2
  • $\begingroup$ Sorry, I am a beginner and it will take me a while to understand your answer completely. But I think your answer satisfies the requirement I have and I accept this as an answer. Thanks a ton for such a nice answer. :) $\endgroup$
    – Nitin
    Commented May 11, 2020 at 15:40
  • 1
    $\begingroup$ Chebyshev succeeds yet again! :D $\endgroup$ Commented May 12, 2020 at 11:52
2
$\begingroup$

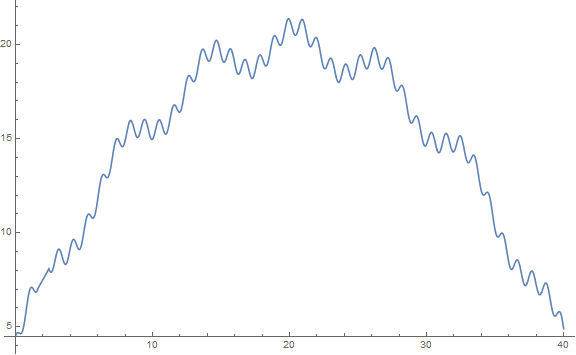
Perhaps something like:

ClearAll[f]
f[x_] := 20 + Sin[x] + Cos[6 x ]/2 - (4 - x/5)^2;

Plot[f[x], {x, 0, 40}, ImageSize -> Large]

enter image description here

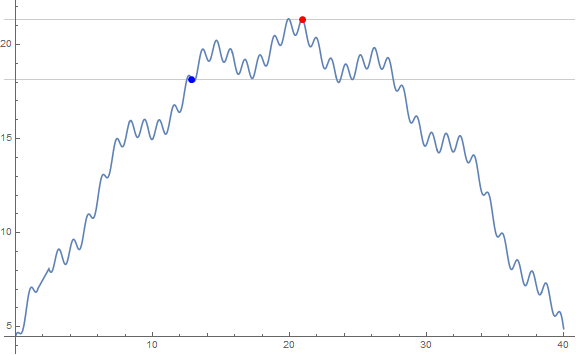
fm1 = NMaximize[{f[x], 0 <= x <= 100}, x]
 {21.3391, {x -> 20.9134}}
t = .15;
fm2 = NMaximize[{f[x], 0 <= x <= 100, f[x] <= (1 - t) fm1[[1]]}, x]
 {18.1383, {x -> 12.8722}}
Plot[f[x], {x, 0, 40}, ImageSize -> Large, 
 GridLines -> {None, {fm1[[1]], (1 - t) fm1[[1]]}}, 
 Epilog -> {PointSize[Large], Red, Point[{#, f@#} &[x /. fm1[[2]]]], 
   Blue, Point[{#, f@#} &[x /. fm2[[2]]]]}]

enter image description here

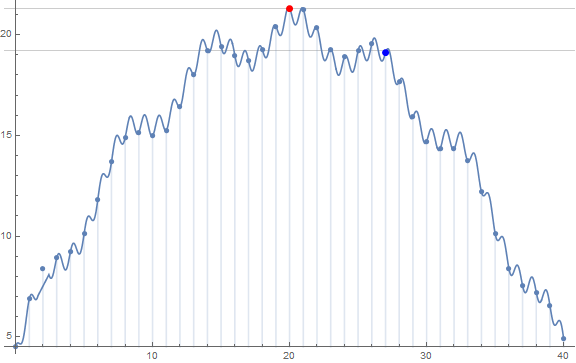
Restricting x to be an integer:

fmi1 = NMaximize[{f[x], 0 <= x <= 100, Element[x, Integers]}, x]
 {21.32, {x -> 20}}
t = .1;
fmi2 = NMaximize[{f[x], 0 <= x <= 100, f[x] <= (1 - t) fmi1[[1]], 
   Element[x, Integers]}, {{x, 1, 35}},  Method -> "DifferentialEvolution"]
{19.0996, {x -> 27}}
 Show[DiscretePlot[f[x], {x, 0, 40}, ImageSize -> Large, 
   GridLines -> {None, {fmi1[[1]], (1 - t) fmi1[[1]]}}, 
   Epilog -> {Red, PointSize[Large], Point[{#, f@#} &[x /. fmi1[[2]]]],
     Blue, Point[{#, f@#} &[x /. fmi2[[2]]]]}], 
   Plot[f[x], {x, 0, 40}]]

enter image description here

Alternatively,

table = N[f /@ Range[0, 40]];
max = Max @ table
21.32
t = .1;

max2 = Max[Clip[table, {0, (1 - t) max}, {0, 0}]]
19.0996
$\endgroup$
2
  • 1
    $\begingroup$ Just to compare: the command of Maple DirectSearch:-GlobalSearch(20 + sin(x) + cos(6*x)/2 - (4 - x/5)^2, {0 <= x, x <= 40}, maximize, solutions = 5, tolerances = 10^(-12)) results in $$\left[ \begin {array}{ccc} 21.3724289594598282&[x= 19.9236819363128568]&68\\ 21.3391456450452992&[x= 20.9134245986743998]&41\\ 20.4803738164238673&[x= 18.9112435714517702]&33\\ 20.3790107170365147&[x= 21.9254682996588954]&62\\ 20.2258685979850484&[x= 14.6569198516607013]&37\end {array} \right] $$ See maplesoft.com/applications/view.aspx?SID=101333 for info. $\endgroup$
    – user64494
    Commented May 10, 2020 at 12:49
  • $\begingroup$ Thank you very much for your time. $\endgroup$
    – Nitin
    Commented May 11, 2020 at 16:03

Your Answer

By clicking “Post Your Answer”, you agree to our terms of service and acknowledge you have read our privacy policy.

Not the answer you're looking for? Browse other questions tagged or ask your own question.