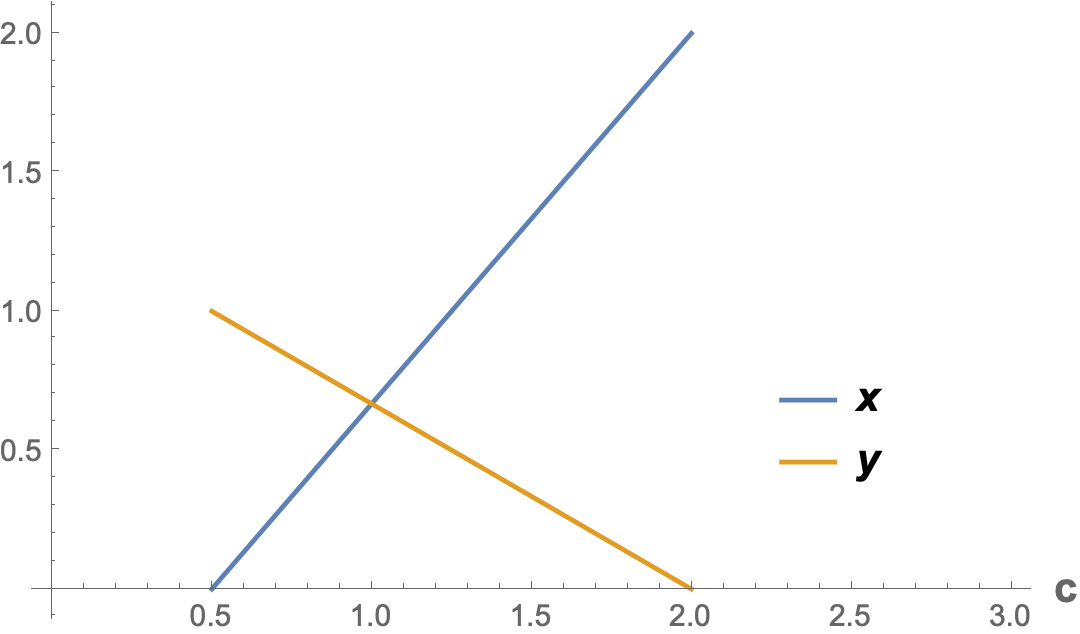
I'm trying to plot the solutions of a set of equations in dependence of a parameter. Say my variables are
vars = {x,y};
and the system I want to solve is
r[c_] := NSolve[Join[{{x (1 - (x + .5 y)/c), y (1 - (.5 x + y))} == {0,
 0}}, {vars > 0}], vars];
This works but the curves have the same color
Plot[vars /. r[c], {c, 0, 3}]
This works but I have to call r[c] every time
Plot[{x /. r[c], y /. r[c]}, {c, 0, 3}]
I hoped to solve the problem with Evaluate but this doesn't work
Plot[Evaluate[vars /. r[c]], {c, 0, 3}]

NSolve::ratnz "NSolve was unable to solve the system with inexact coefficients. The answer was obtained by solving a corresponding exact system and numericizing the result."
In this case there's no plot.
I know it's kind of an aesthetic question but out of curiosity: is there a way to call r[c] only once and still get the curves in different colors?
Thanks!


