I have a dataset, named data as follows:
data = Transpose[{Table[i, {i, 1, 10, 0.1}],
    N[Table[Log[i] + RandomReal[0.5], {i, 1, 10, 0.1}]]}];
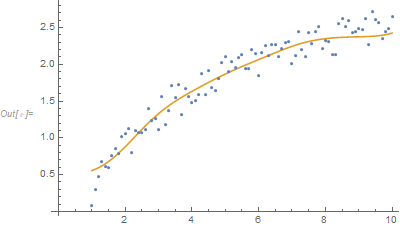
I need to smooth the data using FFTFilters. I can do this in OrginLab software and the results look like the following:
smooth = {{1, 0.55687}, {1.1, 0.57505}, {1.2, 0.59645}, {1.3, 0.62119}, {1.4, 0.64932},
  {1.5, 0.68081}, {1.6, 0.71555}, {1.7, 0.75331}, {1.8, 0.7938}, {1.9, 0.83666},
  {2, 0.88145}, {2.1, 0.92768}, {2.2, 0.97487}, {2.3, 1.02248}, {2.4, 1.07002},
  {2.5, 1.11701}, {2.6, 1.16303}, {2.7, 1.20772}, {2.8, 1.25078}, {2.9, 1.29202},
  {3, 1.3313}, {3.1, 1.36857}, {3.2, 1.40386}, {3.3, 1.43727}, {3.4, 1.46894},
  {3.5, 1.49905}, {3.6, 1.52781}, {3.7, 1.55543}, {3.8, 1.58213}, {3.9, 1.6081},
  {4, 1.6335}, {4.1, 1.65846}, {4.2, 1.68308}, {4.3, 1.70741}, {4.4, 1.73147},
  {4.5, 1.75526}, {4.6, 1.77875}, {4.7, 1.80188}, {4.8, 1.82461}, {4.9, 1.84689},
  {5, 1.86868}, {5.1, 1.88997}, {5.2, 1.91075}, {5.3, 1.93106}, {5.4, 1.95092},
  {5.5, 1.97041}, {5.6, 1.98959}, {5.7, 2.00855}, {5.8, 2.02737}, {5.9, 2.04612},
  {6, 2.06485}, {6.1, 2.08359}, {6.2, 2.10235}, {6.3, 2.12111}, {6.4, 2.13982},
  {6.5, 2.15839}, {6.6, 2.17672}, {6.7, 2.19468}, {6.8, 2.21216}, {6.9, 2.229},
  {7, 2.24507}, {7.1, 2.26026}, {7.2, 2.27446}, {7.3, 2.2876}, {7.4, 2.29962},
  {7.5, 2.31049}, {7.6, 2.32023}, {7.7, 2.32886}, {7.8, 2.33644}, {7.9, 2.34304},
  {8, 2.34873}, {8.1, 2.3536}, {8.2, 2.35774}, {8.3, 2.36123}, {8.4, 2.36416},
  {8.5, 2.36661}, {8.6, 2.36864}, {8.7, 2.37032}, {8.8, 2.37175}, {8.9, 2.37299},
  {9, 2.37417}, {9.1, 2.3754}, {9.2, 2.37684}, {9.3, 2.37869}, {9.4, 2.38116},
  {9.5, 2.38452}, {9.6, 2.38904}, {9.7, 2.39505}, {9.8, 2.40287}, {9.9, 2.41283},
  {10, 2.42525}};

ListPlot[{data, smooth}, Joined -> {False, True}]
Now I have tried to do it in Mathematica to obtain the similar result as got by OriginLab, I did the following operations:
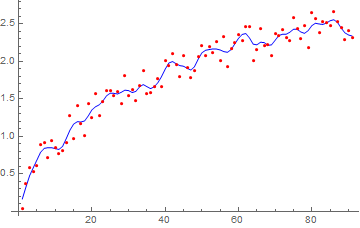
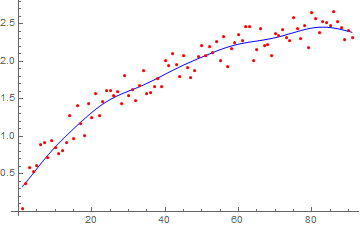
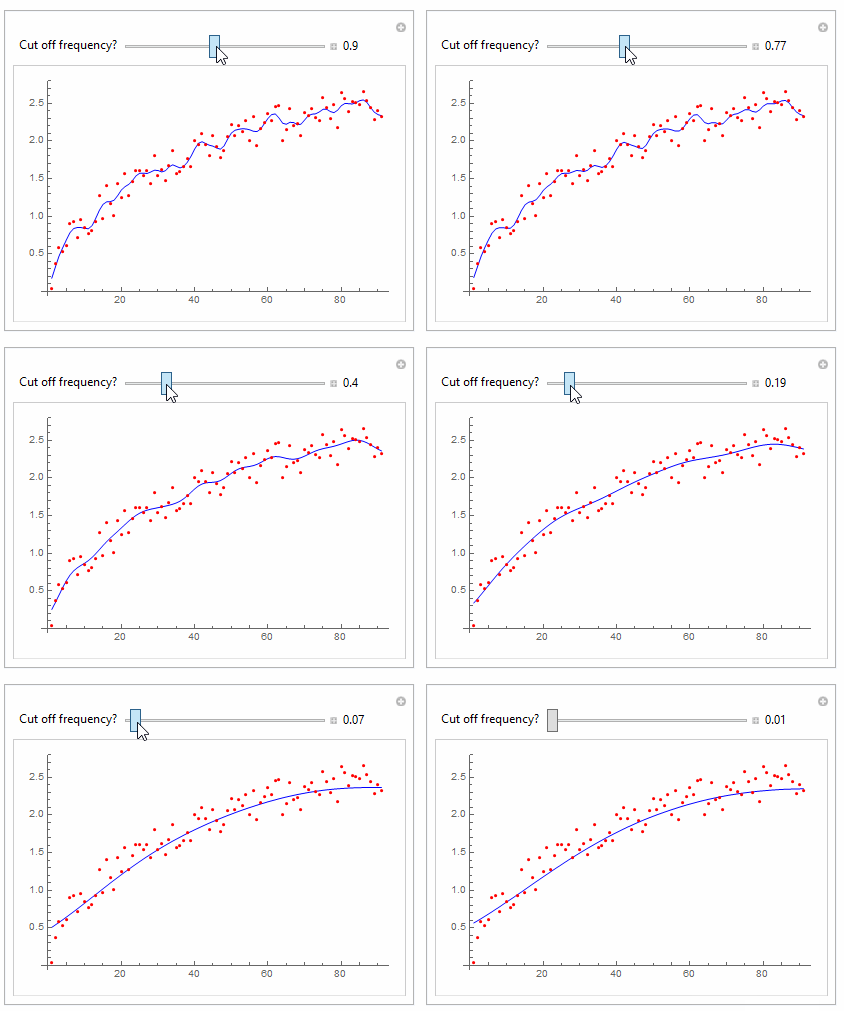
InverseFourier[LowpassFilter[Fourier[Transpose[data][[2]]], 4]];
But I was not able to smooth the above dataset. So, please help to me to get rid of this. Thanks in advance


