30
$\begingroup$

I've been trying to get loglog plots in 3D, but to no avail. My initial approach was to take the logarithm inside the plot i.e

Plot3D[Log[10,function[a, b]],{a, 1, 100000},{b, 1, 1000000}]

but now I'm looking for a way to logarithm-ise the axes as well. Any help would be greatly appreciated!

$\endgroup$
3
  • 2
    $\begingroup$ Something that you could do would be to get the logarithm outside the plot, and then use the LogTicks (from the LevelScheme package) to rescale the axes. This worked for me $\endgroup$
    – Sos
    Commented Mar 13, 2013 at 14:53
  • 3
    $\begingroup$ @Sosi why don't you post that (with details) as an answer? $\endgroup$
    – rcollyer
    Commented Mar 13, 2013 at 15:06
  • 1
    $\begingroup$ @Sosi, thanks, but I'm very new to mathematica and unfamiliar with the LogTicks command. Could you give me any tips on using it? $\endgroup$
    – Gokotai
    Commented Mar 13, 2013 at 17:15

4 Answers 4

28
$\begingroup$

Edit: The new package to install for this comes from the CustomTicks subpackage of the SciDraw package (formerly, LevelScheme).

You first have to install the SciDraw package, it's worth it if you produce a lot of figures. You can see how to do it on the SciDraw guide.

Load the package that you will be using

Get["CustomTicks`"]

Assign a function and do the 3D plot:

function = Log[10, a x + b /. a -> 1];
Plot3D[function, {x, 1, 3}, {b, -1, 3}, 
 PlotRange -> {{1, 3}, {-1, 3}, {-1, 1}}, 
 Ticks -> {LogTicks[10, 1, 3], LogTicks[10, -1, 3], LogTicks[10, -1, 1]}
]

This would produce this figure:
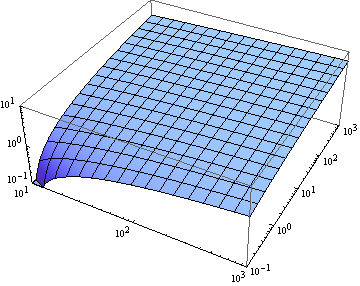
enter image description here

If you wanted to have the yy axis with linear ticks instead you could adapt the Ticks option above. Here, I also changed the PlotRange specification and added an AxesLabel so that it is easier to see.

Plot3D[function, {x, 1, 3}, {b, -1, 3}, 
 PlotRange -> {{1, 2}, {-1, 0}, {-1, 1}}, 
 Ticks -> {LogTicks[10, 1, 3], LinTicks[-1, 0, 0.25, 5], 
   LogTicks[10, -1, 3]}, AxesLabel -> {"x", "y", "z"}]
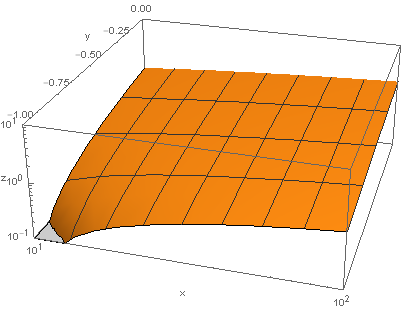
enter image description here

The SciDraw (and more specifically the CustomTicks) package is really nice to do these things!

$\endgroup$
6
  • $\begingroup$ This helped alot, thanks a bunch! $\endgroup$
    – Gokotai
    Commented Mar 13, 2013 at 20:00
  • 2
    $\begingroup$ Maybe still more for future versions of Mathematica but the option ScalingFunctions -> {"Log", "Reverse"} has been introduced for Gauges, Histograms and BarCharts in version 9. Unluckily, it fails in number of instances. I reported this as an error a while ago. Since the implementation is very general, I cannot see why it should not also become available for all other Plot-related functions. $\endgroup$ Commented Mar 14, 2013 at 7:33
  • $\begingroup$ LevelScheme uses the same method that Martin Wijaya uses in his answer, but it adds features to make the plot look more professional. On page 4 of LevelScheme's CustomTickGuide.pdf, it states how to turn logarithmic plots into linear plots, which is how LevelScheme functions. $\endgroup$
    – Paul
    Commented Mar 5, 2014 at 19:34
  • 1
    $\begingroup$ I wonder why I even use the replacement function in my answer... $\endgroup$
    – Sos
    Commented Mar 6, 2014 at 11:51
  • $\begingroup$ @ Sosi, I was trying to utilize your recommendation in here to come up with a 3d surface plot of a two-variable function. The only difference that I have is only one of my x or y axes has logarithmic scale as well as my z axis. I have installed the package required to make use of Ticks option. However, I am receiving error message saying, "Tick specification must be a list or a function" even though I am using exactly the same format as you did in here in my Mathematica 8.0. Do you know what could possibly be the reason for it? Do you recommend me posting a new question? Thanks in advance, $\endgroup$
    – Benjamin
    Commented Apr 16, 2016 at 4:47
11
$\begingroup$

LogTicks is really nice. However, if you might wish to avoid another package or have more control over the final output, here is a template. As mentioned in a comment above, I actually hope that ScalingFunctions will be fully implemented in the future.

function[a_, b_] := Log[10, a + b]

Plot3D[Log[10, function[#^10 &@a, #^10 &@b]], {a, Log10@1, 
  Log10@100000}, {b, Log10@1, Log10@100000}, 
 Ticks -> {Table[{y, ToString[Round[10^y, 0.001]]}, {y, Log[10, 1], 
     Log[10, 100000]}], 
   Table[{y, 
     ToString[
      Round[10^y, 0.001] // ScientificForm // TraditionalForm]}, {y, 
     Log[10, 0.001], Log[10, 100000]}], Automatic}]

enter image description here

$\endgroup$
9
$\begingroup$

You can simply use ScalingFunctions. (It appears red in version 10, but still works.)

function = Log[10, a x + b /. a -> 1];
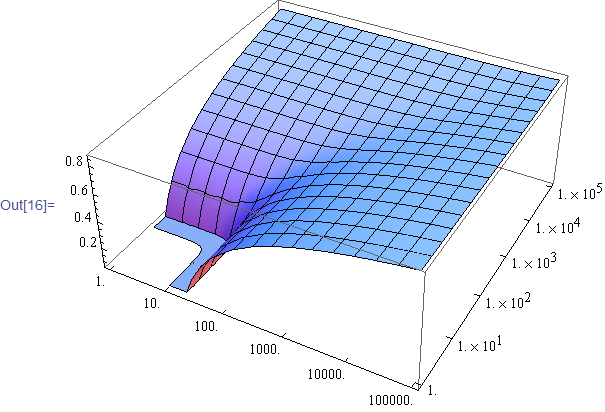
Plot3D[function, {x, 1, 3}, {b, 1, 3}, PlotLabel -> "Normal"]
Plot3D[function, {x, 1, 3}, {b, 1, 3}, 
    ScalingFunctions -> {Identity, Identity, "Log"}, PlotLabel -> "Log"] 

enter image description here

$\endgroup$
1
  • 3
    $\begingroup$ You shouldn't apply Log preliminarily if you use ScalingFunctions -> "Log", just plot the objective function as usual: Plot3D[Evaluate[a x + b /. a -> 1], {x, 1, 3}, {b, 1, 3}, ScalingFunctions -> {Identity, Identity, "Log"}, PlotLabel -> "Log"]. $\endgroup$ Commented Apr 17, 2016 at 11:35
6
$\begingroup$

Perhaps this is what you want:

Let say the function is describe as:

z=Log10[x]+Log10[y]

Where under normal plot, it will give you a curvy surface while on the log plot will give you a rectangular surface.

And you want to rescale the axes of x,y without changing the function of x and y.

Under normal circumstances, you will plot it like below to give you the curvy surface,

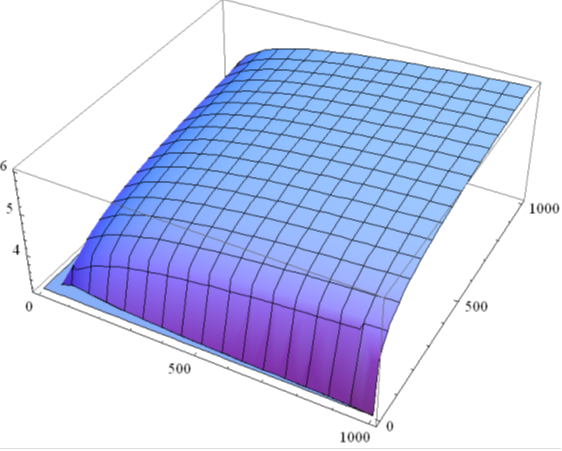
Plot3D[z, {x, 1, 1000}, {y, 1, 1000}]

Surface under normal plot

In order to change it into a rectangular surface due to the change in the x and y axes scale, you can do the following

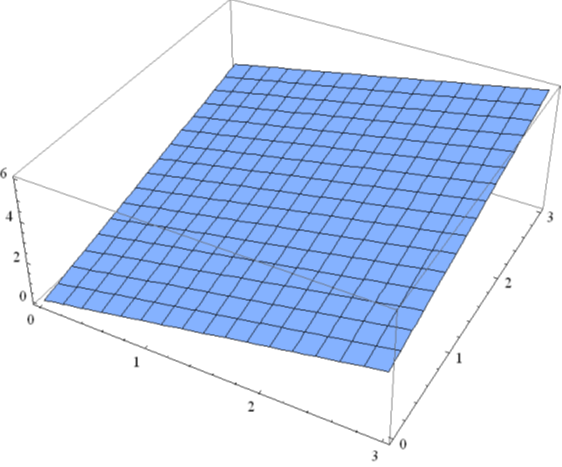
Plot3D[z/.{x->10^a,y->10^b},{a,0,3},{b,0,3}]

Surface by changing the axes

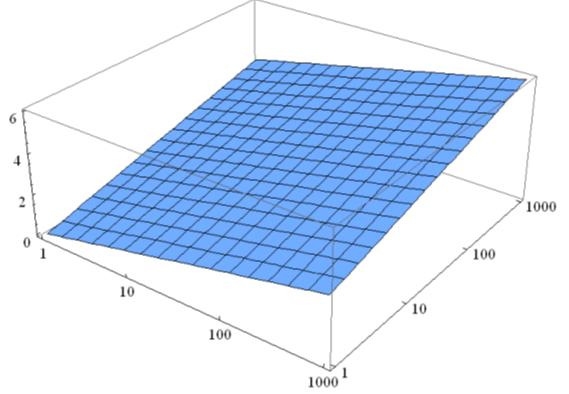
In order to change the axes from a and b to x and y again and keep the log scale, Since I know that if a = 1 then x = 10, then i can just rename the axes with ticks function.you can do the following

Plot3D[z /. {x -> 10^a, y -> 10^b}, {a, 0, 3}, {b, 0, 3}, Ticks -> {Table[{i,10^i},{i,0, 6}], Table[{i, 10^i}, {i, 0, 6}], Automatic}]

Surface by changing the scale

I hope this is what are you looking for.

$\endgroup$

Your Answer

By clicking “Post Your Answer”, you agree to our terms of service and acknowledge you have read our privacy policy.

Not the answer you're looking for? Browse other questions tagged or ask your own question.