23
$\begingroup$

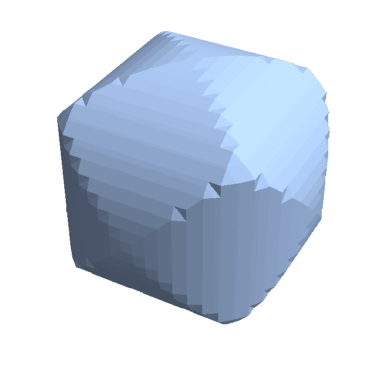
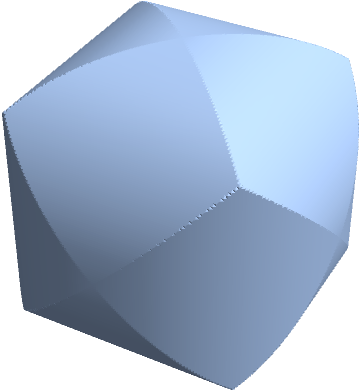
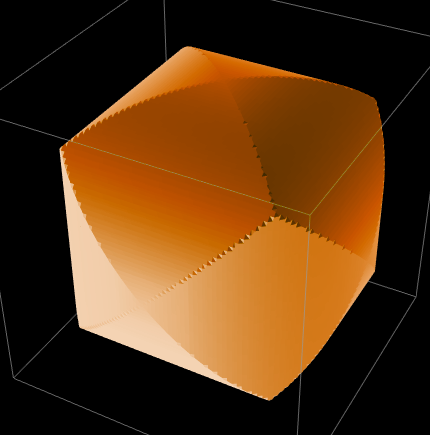
I want to draw this region,but the surface is rough.I tried to find options to improve the surface but failed.

Region[RegionIntersection[Cylinder[{{0, 0, -2}, {0, 0, 2}}],
  Cylinder[{{0, -2, 0}, {0, 2, 0}}], 
  Cylinder[{{-2, 0, 0}, {2, 0, 0}}]]]

which gives

enter image description here

besides, PlotPoints -> 200 seems have no place to put.

$\endgroup$

7 Answers 7

20
$\begingroup$

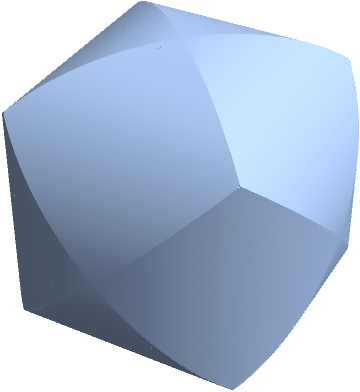
Sometimes, it is easier to discretize before intersecting.

BoundaryDiscretizeRegion@RegionIntersection[
  Map[
   BoundaryDiscretizeRegion[#, 
     MaxCellMeasure -> (1 -> 0.05)] &, 
     {Cylinder[{{0, 0, -2}, {0, 0, 2}}], Cylinder[{{0, -2, 0}, {0, 2, 0}}], 
    Cylinder[{{-2, 0, 0}, {2, 0, 0}}]}
   ]
  ]

enter image description here

$\endgroup$
18
$\begingroup$

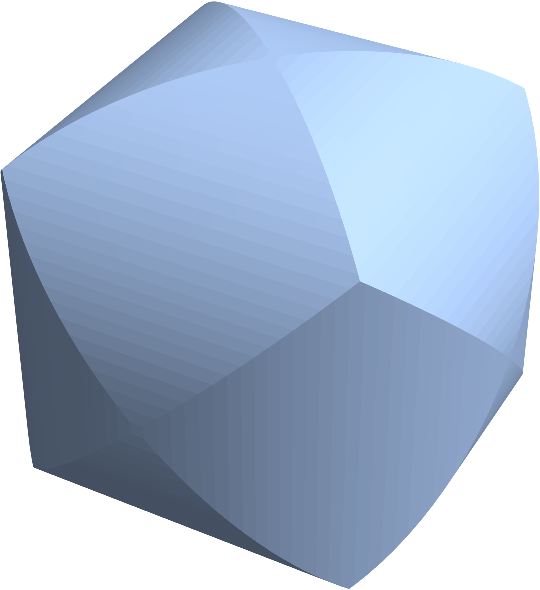
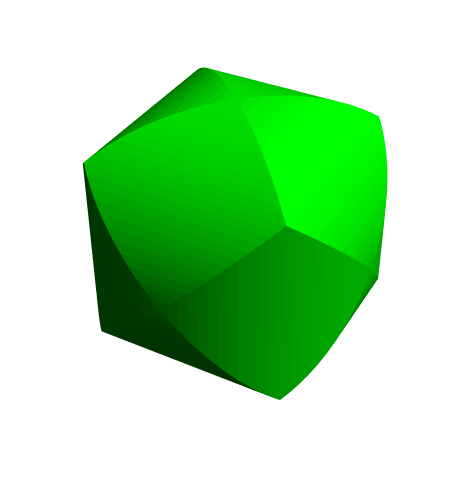
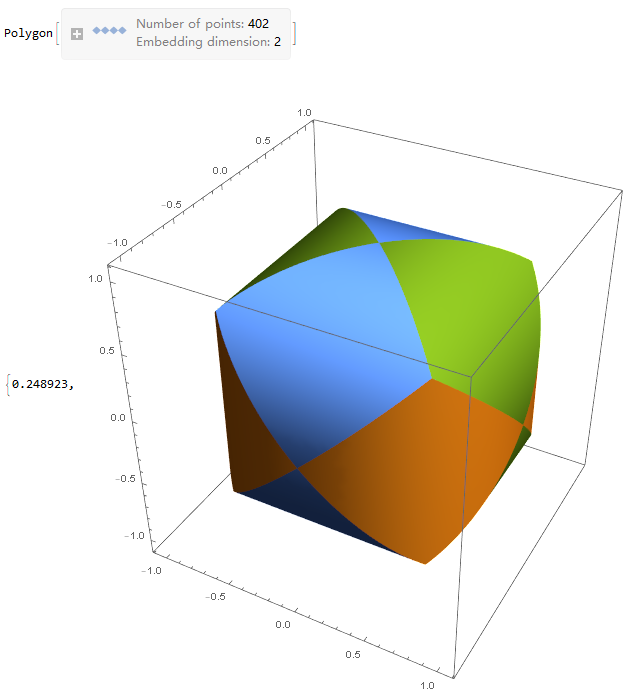
Using OpenCascadeLink from version 12.1 makes this easier and better quality:

Needs["NDSolve`FEM`"]
rr = RegionIntersection[Cylinder[{{0, 0, -2}, {0, 0, 2}}], 
   Cylinder[{{0, -2, 0}, {0, 2, 0}}], 
   Cylinder[{{-2, 0, 0}, {2, 0, 0}}]];
bmesh = ToBoundaryMesh[rr, 
   "BoundaryMeshGenerator" -> {"OpenCascade", 
     "ShapeSurfaceMeshOptions" -> {"LinearDeflection" -> 0.00125}}];
bmesh["Wireframe"[
  "MeshElementStyle" -> Directive[FaceForm[Green], EdgeForm[]]]]

enter image description here

$\endgroup$
6
  • 1
    $\begingroup$ Oh, that's great to know! I am eager to get my hand on the new version to try that! $\endgroup$ Commented Mar 20, 2020 at 19:10
  • 3
    $\begingroup$ @HenrikSchumacher, it's bit like with TetGenLink and TriangleLink, OCCL forms a low level interface and with time more high level functions will make use of that. OpenCascade is a huge library and this first version scratches the surface, I think. It will take time to exploit more of it.... It's hopefully going to be easily accessible for you folks to make contributions too. $\endgroup$
    – user21
    Commented Mar 20, 2020 at 19:34
  • $\begingroup$ Please comment on which OpenCascade app is needed to make this work. $\endgroup$
    – murray
    Commented Mar 20, 2020 at 21:56
  • 3
    $\begingroup$ @murray, you just need Version 12.1 nothing else. ln the Documentation search for OpenCascadeLink for more information on this. $\endgroup$
    – user21
    Commented Mar 21, 2020 at 5:15
  • 1
    $\begingroup$ @murray, it's a link to OpenCascade, does that help? The opencascade libraries now ship with mathematica 12.1 and the link, links to those shipped libraries. $\endgroup$
    – user21
    Commented Mar 23, 2020 at 5:20
15
$\begingroup$
ri = RegionIntersection[Cylinder[{{0, 0, -2}, {0, 0, 2}}], 
   Cylinder[{{0, -2, 0}, {0, 2, 0}}], Cylinder[{{-2, 0, 0}, {2, 0, 0}}]];

You can use PlotPoints as a suboption for Method options:

DiscretizeRegion[ri, 
 Method -> {"DualMarchingCubes", PlotPoints -> 150}]

enter image description here

$\endgroup$
13
$\begingroup$

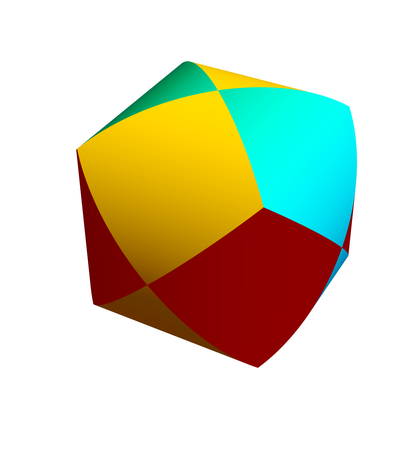
In order to completeness,here we provide another ways to do this. Thanks @xzczd suggestion。

Related How to graph a solid common to multiple functions

  • MeshFunctions
Clear[f, g, h, fgh, ghf, hfg];
SetOptions[ContourPlot3D, PlotPoints -> 80, MaxRecursion -> 4, 
  Mesh -> {{0}, {0}, {0}}, BoundaryStyle -> None, Boxed -> False, 
  Axes -> False];
f = {x, y, z} |-> x^2 + y^2 - 1;
g = {x, y, z} |-> y^2 + z^2 - 1;
h = {x, y, z} |-> z^2 + x^2 - 1;
fgh = ContourPlot3D[
   f[x, y, z] == 0, {x, -1, 1}, {y, -1, 1}, {z, -1, 1}, 
   MeshFunctions -> {g, h}, 
   MeshShading -> {{Red, None}, {None, None}}, MeshStyle -> None];
ghf = ContourPlot3D[
   g[x, y, z] == 0, {x, -1, 1}, {y, -1, 1}, {z, -1, 1}, 
   MeshFunctions -> {h, f}, 
   MeshShading -> {{Yellow, None}, {None, None}}, MeshStyle -> None];
hfg = ContourPlot3D[
   h[x, y, z] == 0, {x, -1, 1}, {y, -1, 1}, {z, -1, 1}, 
   MeshFunctions -> {f, g}, 
   MeshShading -> {{Cyan, None}, {None, None}}, MeshStyle -> None];
Show[fgh, ghf, hfg]
enter image description here

  • CSGRegion
CSGRegion["Intersection", {Cylinder[{{0, 0, -2}, {0, 0, 2}}], 
  Cylinder[{{0, -2, 0}, {0, 2, 0}}], 
  Cylinder[{{-2, 0, 0}, {2, 0, 0}}]}, BaseStyle -> Darker@Cyan]
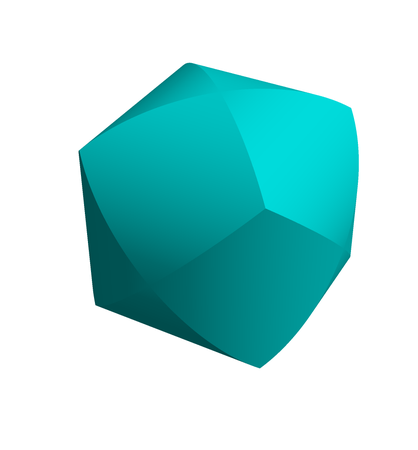
enter image description here

  • OpenCascadeLink` (Thanks @user21)
Needs["OpenCascadeLink`"];
shape = OpenCascadeShape[
   RegionIntersection[Cylinder[{{0, 0, -1}, {0, 0, 1}}], 
    Cylinder[{{0, -1, 0}, {0, 1, 0}}], 
    Cylinder[{{-1, 0, 0}, {1, 0, 0}}]]];
bm = OpenCascadeShapeSurfaceMeshToBoundaryMesh[shape, 
    "ShapeSurfaceMeshOptions" -> {"AngularDeflection" -> .01}] // 
   BoundaryMeshRegion;
RegionPlot3D[bm, ColorFunction -> "Rainbow", Boxed -> False]

Or

Needs["OpenCascadeLink`"];
reg1 = Cylinder[{{0, 0, -2}, {0, 0, 2}}];
reg2 = Cylinder[{{0, -2, 0}, {0, 2, 0}}];
reg3 = Cylinder[{{-2, 0, 0}, {2, 0, 0}}];
shape1 = OpenCascadeShape[reg1];
shape2 = OpenCascadeShape[reg2];
shape3 = OpenCascadeShape[reg3];
bm = OpenCascadeShapeSurfaceMeshToBoundaryMesh[
    OpenCascadeShapeIntersection[shape1, shape2, shape3], 
    "ShapeSurfaceMeshOptions" -> {"AngularDeflection" -> .01}] // 
   BoundaryMeshRegion;
bm // Volume;
RegionPlot3D[bm, ColorFunction -> "Rainbow", Boxed -> False]

enter image description here

$\endgroup$
0
11
$\begingroup$

Yet another way to discretize the Steinmetz solid is to directly derive the required inequalities using RegionMember[]:

ineq = Simplify[RegionMember[RegionIntersection[Cylinder[{{0, 0, -2}, {0, 0, 2}}], 
                                                Cylinder[{{0, -2, 0}, {0, 2, 0}}], 
                                                Cylinder[{{-2, 0, 0}, {2, 0, 0}}]],
                             {x, y, z}], {x, y, z} ∈ Reals]
   -2 <= z <= 2 && x^2 + y^2 <= 1 && -2 <= y <= 2 && x^2 + z^2 <= 1 &&
   -2 <= x <= 2 && y^2 + z^2 <= 1

which can then be fed to ImplicitRegion[]:

reg = ImplicitRegion[ineq, {x, y, z}];
BoundaryDiscretizeRegion[reg, MaxCellMeasure -> {"Length" -> 0.02}]

Steinmetz solid

$\endgroup$
9
$\begingroup$
reg = Polygon[
  Join[#, Reverse[#.DiagonalMatrix[{1, -1}]]] &@
   Table[{x, Min[AngleVector[Mod[x, Pi/2]]]}, {x, 0., 2 Pi, 2 Pi/(25*8)}]]

ParametricPlot3D[{{Cos[t], Sin[t], h}, {h, Cos[t], Sin[t]}, {Cos[t], h, Sin[t]}}, 
  Element[{t, h}, reg], ImageSize -> 600] // AbsoluteTiming

enter image description here

For version 13.x, you need to use Visualization`Core`ParametricPlot3D instead of ParametricPlot3D.
Related link, the-last-syntax-of-parametricplot3d-seems-broken-in-v13-x

$\endgroup$
2
$\begingroup$

Now I know how to solve this:

besides, PlotPoints -> 200 seems to have no place to put.

RegionIntersection[
    Cylinder[{{0, 0, -2}, {0, 0, 2}}],
    Cylinder[{{0, -2, 0}, {0, 2, 0}}], 
    Cylinder[{{-2, 0, 0}, {2, 0, 0}}]] //
RegionPlot3D[#, PlotPoints->80]&

enter image description here

$\endgroup$

Your Answer

By clicking “Post Your Answer”, you agree to our terms of service and acknowledge you have read our privacy policy.

Not the answer you're looking for? Browse other questions tagged or ask your own question.