By setting the determinant of a matrix to 0, I obtain 6 complex solutions for w and plot them. However, You can clearly see that the negative solutions mirror the positive solutions as the solution corresponds to the positive and negative roots.
k = 9; l = 12; m = 2; M = 4 ;
mat = {{m*w^2 - 2*k, k, k*Exp[-3 I*ka]}, {k, M*w^2 - (l + k),
    l}, {-k*Exp[-3 I*ka], l, M*w^2 - (k - l)}};
mydet = ExpToTrig[Det[mat]];
sol = Solve[mydet == 0, w];
funcs = w /. sol;
ReImPlot[funcs, {ka, 0, \[Pi]}, PlotLabel -> "\[Omega](ka) ",
 PlotLegends -> {{"\[Omega]1", "\[Omega]2", "\[Omega]3", "\[Omega]4",
    "\[Omega]5", "\[Omega]6"}, "ReIm"}, ReImLabels -> {"Re", "Im"},
 Frame -> True]
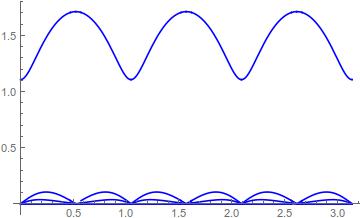
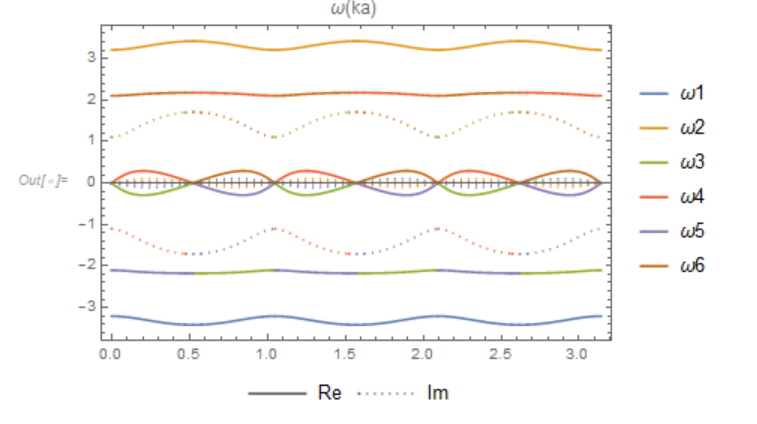 I would like to extract the positive complex solutions of w to use in the following derivative to find the density of states. I tried plotting for w2, w4, w6 only but it seems that I will be missing some other positive solutions for different ka's.
n = Pi / ka;
dkdw = D[funcs, ka];
dNdw = n/Pi * dkdw;
ReImPlot[dNdw , {ka, 0, \[Pi]}, PlotLabel -> "Density of States ",
 PlotLegends -> {{"dN/d\[Omega]1", "dN/d\[Omega]2", "dN/d\[Omega]3",
    "dN/d\[Omega]4", "dN/d\[Omega]5", "dN/d\[Omega]6"}, "ReIm"},
 ReImLabels -> {"Re", "Im"}, Frame -> True]
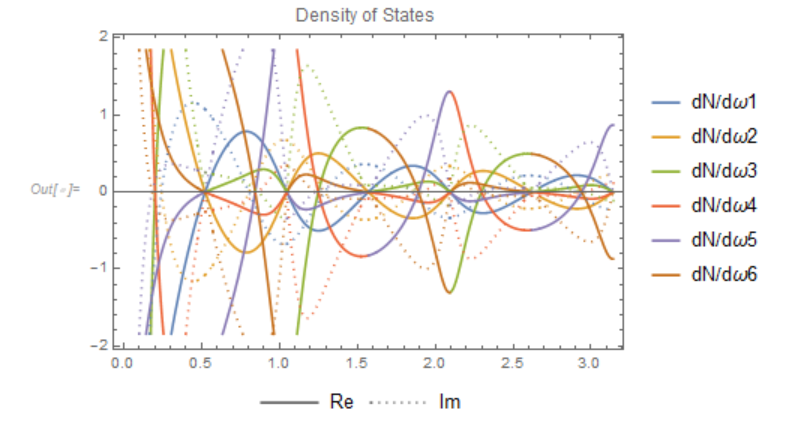 In summary, I want to extract the upper part of the first graph to plot the derivative of those solutions in the second graph.

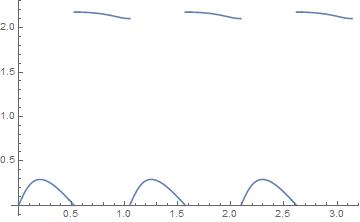
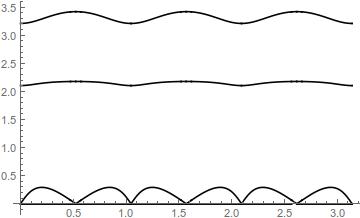
funcslist, and there’s only six of them, so can’t you just plot them one by one (say, the real part only for instance), so you can inspect them visually and select the ones that you want? $\endgroup$