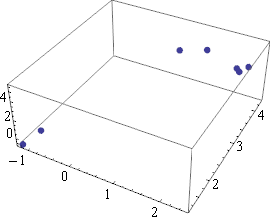
I have a txt file with space-delimited x, y, z coordinates of several points. The points are organized into groups of unequal size; the groups are delimited by skipping a line, like this:
2.3 3.4 5.5
2.4 3.3 5.6
2.5 3.5 5.6

1.2 4.3 3.3
0.7 4.0 3.5

-1.2 1.3 -0.7
-1.1 1.7 -0.5
I can't find a way to have Mathematica just import these then plot the points! I've tried searching a little bit but didn't find a similar question.
When plotting, it's not important to distinguish from which group each point came from. For example, I don't need different colours for each group or anything like that.

