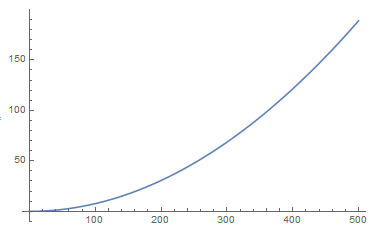
Short version: My understanding of the use of TargetUnits in a Plot statement is that if the function being plotted has units, MMA will attempt to convert the output of that function to the unit form specified by TargetUnits. Yet it does not seem to be doing that. What am I missing?
Context: I am writing some general routines for analyzing a particular type of system of differential equations. These can be of arbitrary complexity, although with a well-defined relationship among units. I have been unable to get MMA to execute NDSolve on systems that include units, so I have developed a way to convert all units to SI, strip the units, do the NDSolve, and then re-add appropriate units to the resulting InterpolatingFunctions. When I look at individual values resulting from those InterpolatingFunctions, the results look right. But when I try to plot the results using TargetUnits, they do not.
Simplified Example:
rateeq[t_] = {a'[t] == k1 b[t] + k2 a[t] b[t] + k3 b[t]^2,
              b'[t] == -k1 b[t] - k2 a[t] b[t] - k3 b[t]^2};
initCond[t_] = {b[t] == Quantity[10^-9, "Molar"],
                a[t] == Quantity[10^-5, "Molar"]};
rateConstValues = {k1 -> Quantity[7000, 1/"Seconds"],
                   k3 -> Quantity[5.4 10^9, 1/("Molar" "Seconds")],
                   k2 -> Quantity[1.8 10^7, 1/("Molar" "Seconds")]};
quantitiesToSolveFor[t_] = {a[t], b[t]};
Here is my function to strip units after converting to SI:
UnitStrip[exp_] := Replace[exp, a_?QuantityQ :> QuantityMagnitude[UnitConvert[a]], All]
I have tested it and found it to work as expected. Here is my call to NDSolve:
result = NDSolve[UnitStrip[Join[rateeq[t],
                           initCond[Quantity[0, "Microseconds"]]] /.
                           rateConstValues],
                 quantitiesToSolveFor[t],
                 UnitStrip[{t, 0, Quantity[500, "Microseconds"]}]][[1]]
This gives me replacement rules for a[t] and b[t] as InterpolatingFunctions. I can make a version of those same results but with the units put back in as follows:
UnitizedResult = (# -> (Quantity[# /. result, "Moles"/"Meters"^3] /.
                  t -> (t/Quantity[1, "Seconds"]))) & /@
                 (quantitiesToSolveFor[t])
Let's turn b[t] into a function and test a value:
f[t_] = b[t] /. UnitizedResult;
UnitConvert[f[Quantity[250, "Microseconds"]], "Molar"]

(* 1.65921 10^-10 M *)
And that result is correct. Here is the strange part:
Plot[Evaluate[f[t]],
     {t, Quantity[0, "Microseconds"], Quantity[500, "Microseconds"]},
     TargetUnits -> "Molar"]
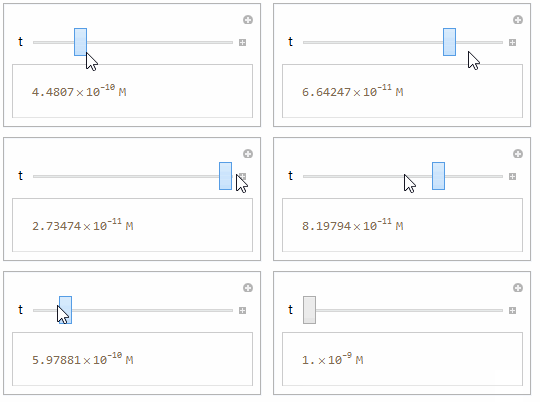
Not only is the magnitude way off (around 11 orders of magnitude), the trend is wrong... it should be a decreasing function approaching zero as an asymptote. I have verified that f[t] behaves as it should using a Manipulate:
Manipulate[UnitConvert[f[Quantity[t, "Microseconds"]], "Molar"], {t, 0, 500}]
Any ideas?
Edited to Add: So if I don't do the conversion on the t axis to a unitized version, everything works fine. Does anyone know why my approach for transforming the t axis isn't working right here? And does anyone have a way to do the conversion successfully?


TargetUnits->{"Microseconds", "Molar"}? $\endgroup$