14
$\begingroup$

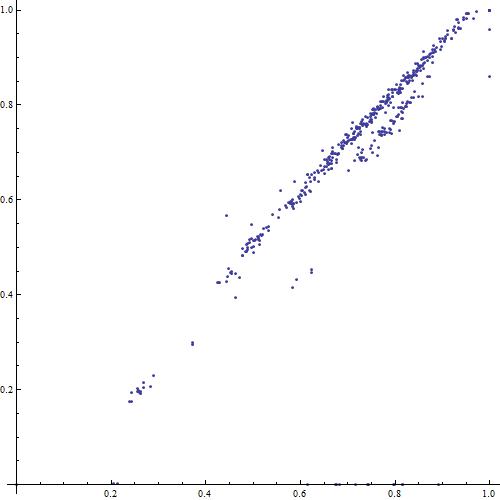
I have a large data set of experimental data for which I have determined a theoretical fit. However, for some of the experimental data I took, there was systematic error, leading to the data deviating from the expected fit as shown below (experimental values are plotted on x-axis and theoretical values are plotted on y-axis).

graph of data and outliers

Is it possible to write some code to allow one to simply click on the outliers and determine their index, or is there any way to do so natively in Mathematica?

It would also be possible for me to divide the values plotted on the y-axis by those plotted on the x-axis, but I'm wondering whether there's a general method allowing you to click on to identify outliers on any graph.

My code for the graph is as follows (I'm only plotting the first 500 values):

Show[ListPlot[Prepend[Transpose[{experimentalCR[[1 ;; 500]], 
 theoreticalCR[[1 ;; 500]]}], {0, 0}]], ImageSize -> {500, 500}, AspectRatio -> Full]

A sample of the data can be found here: http://pastebin.com/mA6VxPfw

$\endgroup$
2
  • $\begingroup$ @Chris Degnen you're a genius. Thanks a lot! could you specify some references for the method that you have used? $\endgroup$
    – meriens
    Commented Mar 26, 2013 at 10:50
  • $\begingroup$ @meriens I'm not sure if Chris will see the comment here. Perhaps you should post it at his answer? $\endgroup$ Commented Mar 26, 2013 at 13:57

4 Answers 4

9
$\begingroup$

You might like to try Tooltip:

mixeddata = 
  Prepend[Transpose[{experimentalCR[[1 ;; 500]], 
     theoreticalCR[[1 ;; 500]]}], {0, 0}];

ListPlot[Table[
  Tooltip[mixeddata[[i + 1]], i], {i, Length@mixeddata - 1}], 
 ImageSize -> {500, 500}, AspectRatio -> Full]

Or equivalently:

 ListPlot[MapThread[
  Tooltip[#1, #2] &, {mixeddata, Range[0, Length@mixeddata - 1]}], 
 ImageSize -> {500, 500}, AspectRatio -> Full]

The graphic is the same, so I won't show it here: the tooltips won't show, after all. The reason I used the index specification that I do is because of that {0,0} you prepreded. If you had added it at the end, this wouldn't have been needed. As kguler's answer shows, you can put anything in the Tooltip.

As another aside, you don't need the Show, you can just apply the desired options (AspectRatio etc) directly in the ListPlot.

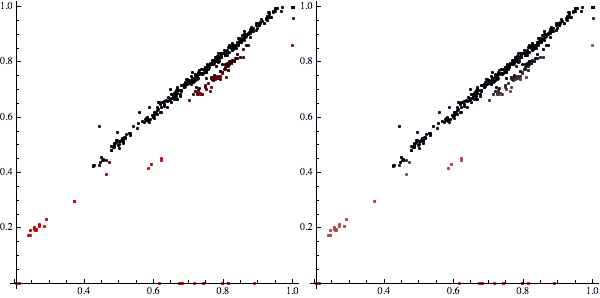
As for identifying the outliers, it depends what constitutes outliers in your dataset. For cases like yours with experimental data and theoretical data, here are some suggestions based on styling the individual points. In the each graph, redder dots are greater outliers.

Row[{ListPlot[
   Style[{##}, Blend[{Red, Black}, (#2/#1)^8]] & @@@ (Rest@mixeddata),
    ImageSize -> 300, AspectRatio -> 1], 
  ListPlot[Style[{##}, 
      Hue[1, 1 - (#2/#1)^4, 0.9 - (#2/#1)^8]] & @@@ (Rest@mixeddata), 
   ImageSize -> 300, AspectRatio -> 1]}]

enter image description here

$\endgroup$
3
  • $\begingroup$ thank you for your answer! actually, I prepended the {0,0} because I wanted to force the graph to display the origin - is there any better way to do this? $\endgroup$ Commented Feb 26, 2013 at 11:24
  • 3
    $\begingroup$ @VincentTjeng PlotRange -> {{0, 1}, {0, 1}} $\endgroup$ Commented Feb 26, 2013 at 11:35
  • $\begingroup$ @belisarius thank you. I'm horrible at searching through documentation. $\endgroup$ Commented Feb 26, 2013 at 11:38
8
$\begingroup$

This method uses single prediction confidence intervals to determine and select outliers. The confidence levels are set to 1, 2 and 3 standard deviations. The points outside 3 SD can be found in o3 and the points outside 1 SD can be found in o1 and o3 combined. The points in o1 and o3 are plotted in the chart in green and red respectively.

data = Transpose@{experimentalCR, theoreticalCR};
{mx, my} = 1.1*Max /@ {experimentalCR, theoreticalCR};

{sd1, sd2, sd3} = 
  2*(CDF[NormalDistribution[0, 1], #] - 0.5) & /@ {1, 2, 3};

lm = LinearModelFit[data, {1, x }, x];

getseries[sd_] := Module[{cb},
  cb = lm["SinglePredictionBands", ConfidenceLevel -> sd];
  {lower, upper} = Transpose[cb /. x -> # & /@ experimentalCR];
  p1 = Position[
    MapThread[#1 <= #2 <= #3 &, {lower, theoreticalCR, upper}], True];
  Extract[data, p1]]

s3 = getseries[sd3];
o3 = Complement[data, s3];

s1 = getseries[sd1];
o1 = Complement[s3, s1];

{bands68[x_], bands95[x_], bands99[x_]} = Table[lm["SinglePredictionBands",
    ConfidenceLevel -> cl], {cl, {sd1, sd2, sd3}}];
Show[ListPlot[data],
 Plot[{lm[x], bands68[x], bands95[x], bands99[x]},
  {x, 0, mx}, Filling -> {2 -> {1}, 3 -> {2}, 4 -> {3}}],
 ListPlot[o1, PlotStyle -> Directive[Green, PointSize[Large]]],
 ListPlot[o3, PlotStyle -> Directive[Red, PointSize[Large]]],
 AxesOrigin -> {0, 0}, PlotRange -> {{0, mx}, {0, my}},
 ImageSize -> 480, Frame -> True]
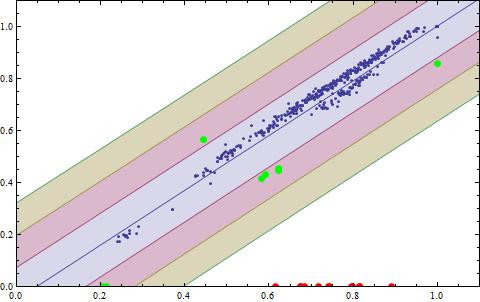
enter image description here

Edit

It seems appropriate to add an alternative method, (although the data in this case does not suggest the suitability of a multivariate fit):-

data = Transpose@{experimentalCR, theoreticalCR};
prange = Sort[#][[{1, -1}]] & /@ {experimentalCR, theoreticalCR};

{{xmin, xmax}, {ymin, ymax}} = {#1, #2*1.35} & @@@ prange;
(* For values within two standard deviations,(approx 95.45% of values) *)
sd = 2;
cl = 2*(CDF[NormalDistribution[0, 1], sd] - 0.5);
Needs["MultivariateStatistics`"];
e = EllipsoidQuantile[data, cl];
ctr = e[[1]];
{r1, r2} = e[[2]];
inc = ArcTan[e[[3, 1, 2]]/e[[3, 1, 1]]]*180/Pi;
Print["Ellipse center = " <> ToString@ctr];
Print["Ellipse radii (r1, r2) = " <> ToString@{r1, r2}]; Print[
 StringJoin["Ellipse inclination = ", ToString@inc, " degrees"]];

(* Find the foci of the ellipse *)
f = Sqrt[r1^2 - r2^2];
dx = f*Cos[inc Degree];
dy = f*Sin[inc Degree];
f1 = ctr - {dx, dy};
f2 = ctr + {dx, dy};

edge = ctr + r1*e[[3, 1]];
rlim = EuclideanDistance[edge, f1] + EuclideanDistance[edge, f2];
(* nod to belisarius here *)
inside[{x_, y_}, {f1_, f2_}] := 
  Sum[EuclideanDistance[{x, y}, i], {i, {f1, f2}}];
sd = Select[data, inside[#, {f1, f2}] < rlim &];

Show[RegionPlot[inside[{x, y}, {f1, f2}] < rlim,
  {x, xmin, xmax}, {y, ymin, ymax}],
 ListPlot[data], Graphics[{Green, Point@sd}],
 Graphics@e,
 Graphics[{Black, Thick, Dashing[0.05],
   Rotate[Circle[ctr, {r1, r2}], inc Degree]}],
 Graphics[{Red, Line[{ctr + r1*e[[3, 1]], ctr, ctr + r2*e[[3, 2]]}]}],
 Graphics[{Yellow, PointSize[Large], Point[{f1, f2}]}],
 PlotRange -> {{xmin, xmax}, {ymin, ymax}},
 AspectRatio -> (ymax - ymin)/(xmax - xmin), ImageSize -> 300]
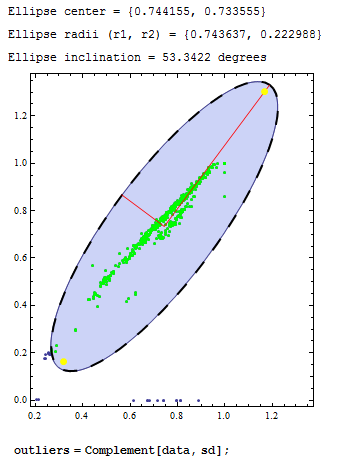
enter image description here

$\endgroup$
3
  • $\begingroup$ hi @Chris, what's your reason behind choosing an ellipse here? If i understand correctly, points are considered to be outliers by your program if and only if they lie outside the ellipse. However, assuming that the graph is one of theoretical against experimental values, wouldn't the points have to lie on a line, as in the first part of your explanation? $\endgroup$ Commented Mar 2, 2013 at 2:18
  • $\begingroup$ @Vincent - included it for general reference, (outlier identification). $\endgroup$ Commented Mar 2, 2013 at 17:49
  • $\begingroup$ I see. thank you! $\endgroup$ Commented Mar 3, 2013 at 2:03
6
$\begingroup$

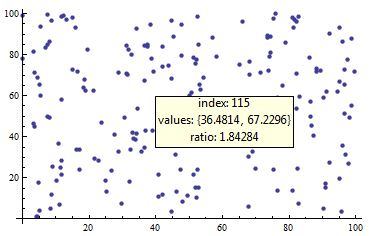
From a related Q/A: Extracting the coordinate of a particular point of interest from a ListPlot

   data = RandomReal[100, {200, 2}];
   ListPlot[Tooltip[data[[#]],
   Column[{Row[{"index: ", # }],
    Row[{"values: ", data[[#]]}],
    Row[{"ratio: ", data[[#]][[2]]/data[[#]][[1]]}]}, Center]] & /@
    Range[Length[data]], PlotStyle -> PointSize[Medium]]

enter image description here

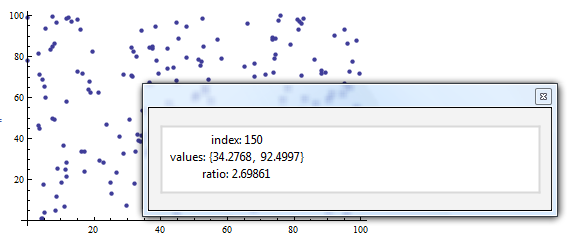
Or, replace Tooltip by PopupWindow in the above code to get

enter image description here

$\endgroup$
3
  • $\begingroup$ thank you for the well-explained answer! both you and Verbeia have come up with a great answer that really helps me. However, is there any simple way to click on the data point and add its index to a list which we can extract later? I'm not sure how to extract the index. $\endgroup$ Commented Feb 26, 2013 at 11:35
  • $\begingroup$ @VincentTjeng, please check "Update 2" in the linked Q/A for an example that does something quite similar. $\endgroup$
    – kglr
    Commented Feb 26, 2013 at 11:39
  • $\begingroup$ got it, thank you. $\endgroup$ Commented Feb 26, 2013 at 11:44
1
$\begingroup$

Look at my answer here where I use Annotation[...,"Mouse"] and MouseAnnotation[] to get the index of a curve that is clicked on in a plot. The same technique could be applied to individual data points in a LineListPlot[...,Joined->False]. It will not work with ListPlot, which is an older function that does not support Annotation.

$\endgroup$
1
  • $\begingroup$ Thank you, looks like something I should try. $\endgroup$ Commented Mar 2, 2013 at 2:18

Your Answer

By clicking “Post Your Answer”, you agree to our terms of service and acknowledge you have read our privacy policy.

Not the answer you're looking for? Browse other questions tagged or ask your own question.