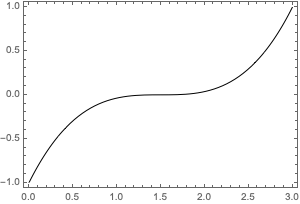
I have some control points and I could just plot the Bezier curve, but I also need to have the function! How can I get the exact function of the plotted Bezier curve?
3 Answers
In the documentation for BezierCurve, under Properties & Relations, it is written that a Bezier curve can be constructed from a sum of Bernstein polynomials. They give the following example:
pts = {{0, -1}, {1, 1}, {2, -1}, {3, 1}};
Graphics[BezierCurve[pts, SplineDegree -> 3], Frame -> True]

f[t_] := Sum[pts[[i + 1]] BernsteinBasis[3, i, t], {i, 0, 3}]
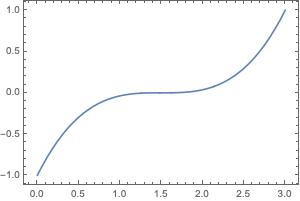
ParametricPlot[f[t], {t, 0, 1}, Frame -> True, Axes -> False]

You can read about this relationship on MathWorld.
-
-
$\begingroup$ Get parametric polynomial expression for x and y with
PiecewiseExpand g[t_] = f[t] // PiecewiseExpand // Simplify[#, 0 <= t <= 1] &yields{3 t, (-1 + 2 t)^3}.ParametricPlot[g[t], {t, 0, 1}, Frame -> True, Axes -> False, GridLines -> Automatic]Get y as a function of xSolve[Thread[{x, y} == {3 t, (-1 + 2 t)^3}], y, {t}]yields{{y -> 1/27 (-3 + 2 x)^3}}$\endgroup$– Akku14Commented Aug 7, 2022 at 4:23
I've made a function that can convert any BezierCurve of any degree into a set of curves, each parameterized from 0 to 1. First, convert the BezierCurve points to a new set of points:
compositeBezierPoints[bezierCurvePoints_, degree_Integer] :=
Select[
  Partition[bezierCurvePoints, UpTo[degree + 1], 1][[1 ;; -1 ;; degree]],
  Length[#] > 1 &]

compositeBezierPoints[bezierCurvePoints_, 1] :=
Select[
  Partition[bezierCurvePoints, UpTo[2], 1],
  Length[#] > 1 &]
If you input the points of the BezierCurve, and the degree (Automatic is degree 3), then compositeBezierPoints breaks up the points into a new set of points expected by BezierFunction. You would map BezierFunction over this list to get a list of functions that are each parameterized from 0 to 1. Here's a Manipulate showing the equivalence for a range of degrees:
pts = Table[{i, RandomReal[{-10, 10}]}, {i, 15}];
Manipulate[
  Show[
    Graphics[{Red, Point[pts]}],
    ParametricPlot[
      Evaluate[Through[(BezierFunction /@ compositeBezier[pts, d])[t]]],
      {t, 0, 1}],
    Graphics[{Black, Dashed, BezierCurve[pts, SplineDegree -> d]}]],
  {d, 1, 6, 1}]
You can re-parameterize the composite parts into a Piecewise function that itself runs from 0 to 1. I use BezierSymbolicFunction (found somewhere on MSE) to get the arc lengths in order to scale the segments:
BezierSymbolicFunction[pts_?MatrixQ] :=
Function[Evaluate[Sum[pts[[i+1]] BernsteinBasis[Length[pts]-1, i, #], {i, 0, Length[pts]-1}]]]

makeBezierPiecewise[bezierCurvePoints_, degree_Integer] :=
Module[{symbolicSegments, bezierSegments, lengths, ends},
  symbolicSegments = BezierSymbolicFunction /@ compositeBezier[bezierCurvePoints, degree];
  bezierSegments = BezierFunction /@ compositeBezier[bezierCurvePoints, degree];
  lengths = ArcLength[#[t], {t, 0, 1}]& /@ symbolicSegments;
  ends = Prepend[Accumulate[lengths/Total[lengths]], 0.];
  Function[Evaluate[
    Piecewise[
      Table[
        {
          bezierSegments[[i]][(#-ends[[i]])/(ends[[i+1]] - ends[[i]])],
          ends[[i]] < # <= ends[[i+1]]},
        {i, 1, Length[ends]-1}]]]]]
