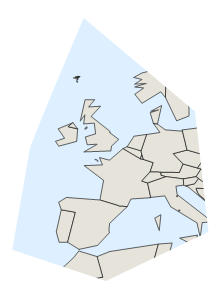
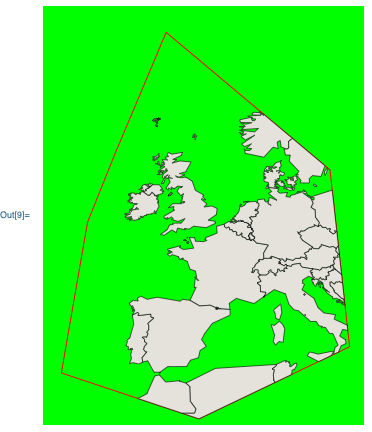
What is the best way to clip a graphic to a certain region?
Here's a very simple implementation to show what I mean:
Show[
 CountryData["World", "Shape"],
 Graphics[{White,
   FilledCurve[{{Line[{{-200, -100}, {200, -100}, {200, 100}, {-200,
         100}}]}, {Line[{{-10.181224213835492, 65.15571149065886},
              {-4.290845998237188,
         79.14535975270482}, {14.116585925507536,
                63.683116936759234}, {16.32547775635689,
         43.80309045911497},
              {-0.6093596134882375,
         35.70382041266731}, {-16.071602429433796,
                40.85790135131583}, {-13.126413321634658,
         57.79273872116096}}]}}]}],
 PlotRange -> {{-18, 18}, {35, 82}}, Background -> LightBlue
 ]

My aim is to be able to clip arbitrary vector graphics to an arbitrary vector region. The region can be anything, and can have curved boundaries (but approximation with line segments is okay).
The problem with the approach I showed here (i.e. simply overlaying a rectangle with a hole in it) is that it is cumbersome and it does not allow arbitrary layering of objects: imagine that I need this clipped graphic to be in the foreground and cover parts of the background objects.
Note: It is possible to clip raster graphics using Texture, as shown here. This question is about clipping arbitrary vector graphics. If it is not possible to do this in the current version of Mathematica, I accept that.


<< Version5``Graphics``and as far as I can tell, the PostScript engine can only deal with rectangular clipping regions. $\endgroup$