0
$\begingroup$

How can I create a circle for the equation

$\qquad x^2+(y-a)^2=9$

where $a$ is a parameter. I want to plot this curve with a slider $(a)$ in Cartesian coordinates (better with axes). If possible, can u guys draw $a x^2 + bx + c = 0$ in the same plane.

https://i.sstatic.net/vcSvW.jpg Manipulate[ ContourPlot[{x^2 + (y - a)^2 == 9}, {x, -14, 14}, {y, -14, 14}, Axes -> True], {a, -3, 3, 1}]

$\endgroup$
4
  • 2
    $\begingroup$ What code did you use that resulted in you asking this question? $\endgroup$
    – JimB
    Commented May 27, 2019 at 5:30
  • $\begingroup$ You ask us to correct your code, but you make it impossible because you don't give your code. $\endgroup$
    – m_goldberg
    Commented May 27, 2019 at 14:03
  • $\begingroup$ Manipulate[ContourPlot[{x^2 + (y - a)^2 == 9}, {x, -14, 14}, {y, -14, 14}, Axes -> True], {a, -3, 3, 1}] $\endgroup$
    – kile
    Commented May 27, 2019 at 15:50
  • $\begingroup$ Welcome to Mathematica.SE, kile! I suggest the following: 1) Take the tour and check the faqs. 2) When you see good questions and answers, vote them up by clicking the gray triangles, because the credibility of the system is based on the reputation gained by users sharing their knowledge. Also, please remember to accept the answer, if any, that solves your problem, by clicking the checkmark sign! 3) As you receive help, try to give it too, by answering questions in your area of expertise. $\endgroup$
    – Chris K
    Commented May 27, 2019 at 15:56

1 Answer 1

4
$\begingroup$

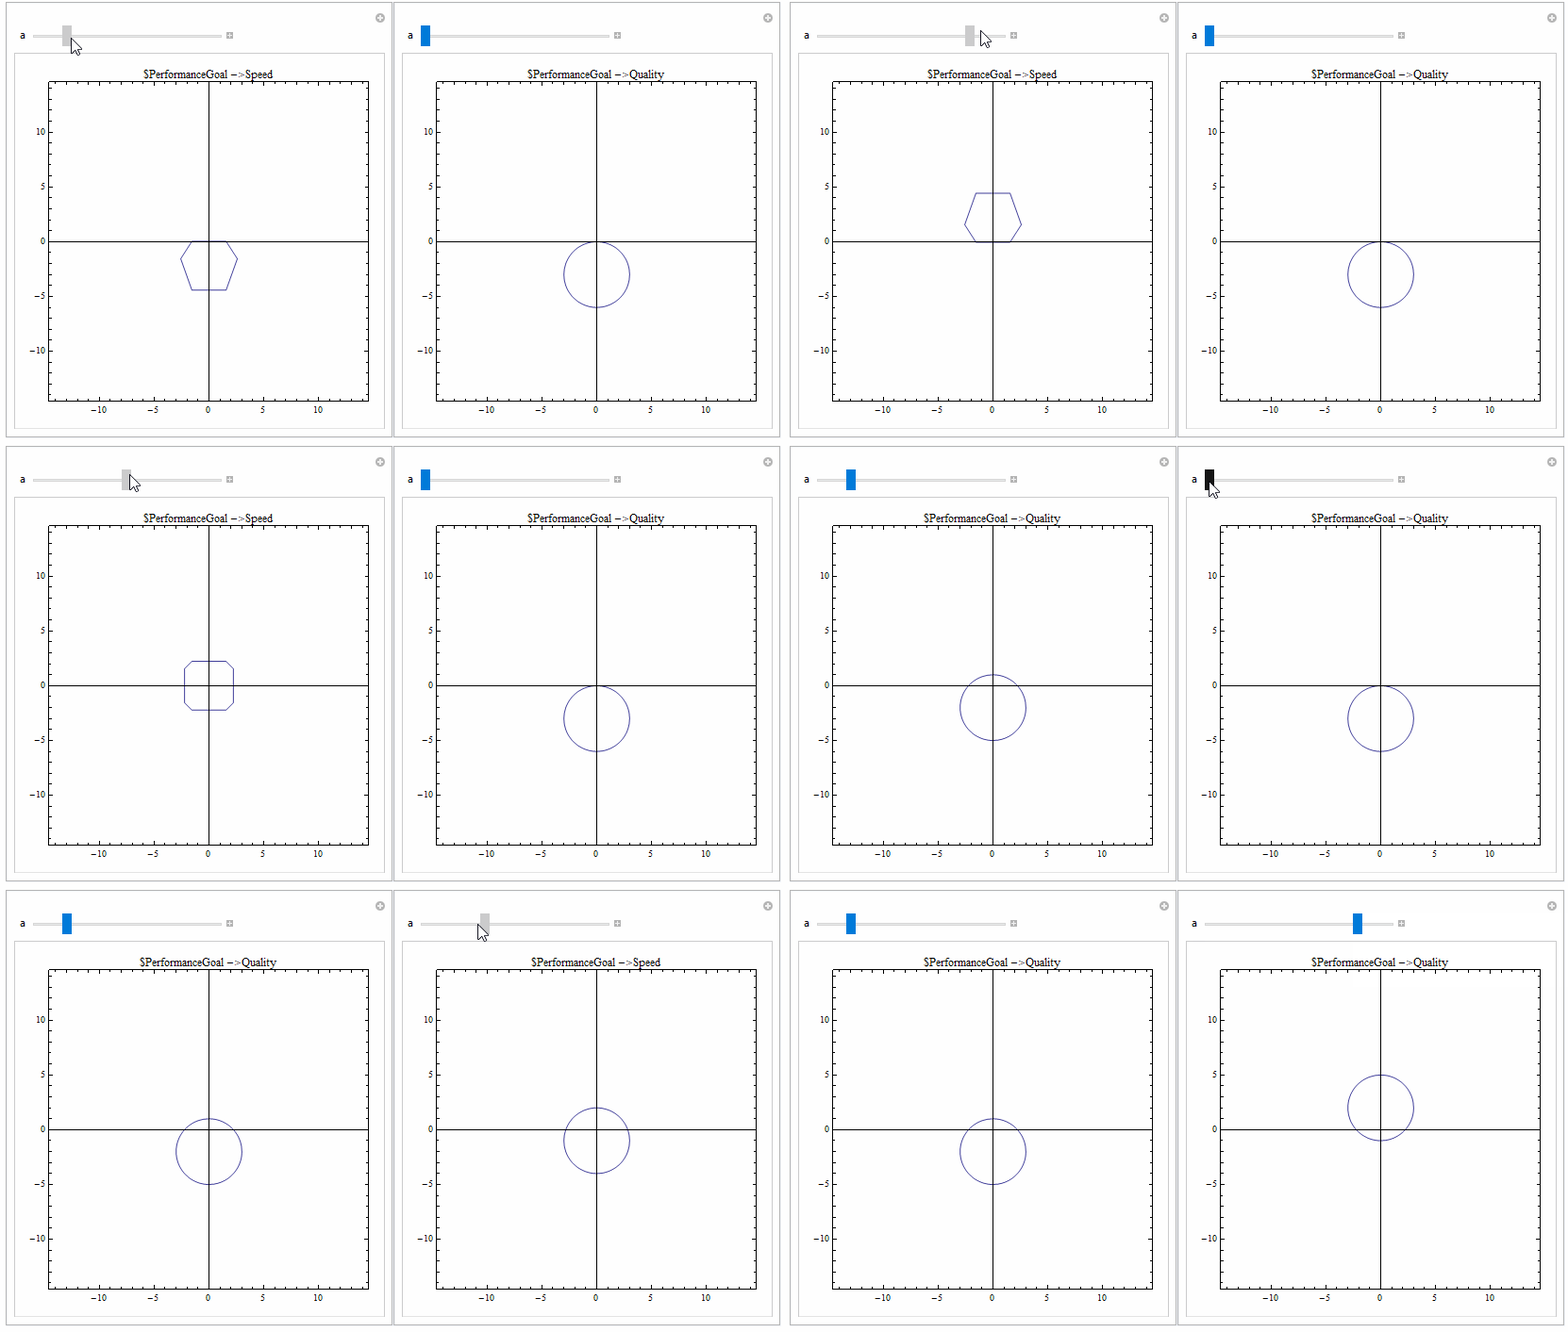
"Why did this circle change its contour when it moved?"

Options[ContourPlot, PerformanceGoal]

{PerformanceGoal :> $PerformanceGoal}

PerformanceGoal >> Properties & Relations:

$PerformanceGoal is effectively ControlActive["Speed", "Quality"]

ControlActive >> Details

ControlActive can be used to switch between a faster computation to be done while controls like sliders are being moved, and a slower computation to be done once the controls are released.

To override the default setting for PerformanceGoal add the option PerformanceGoal -> "Quality" to ContourPlot.

Row[{Manipulate[ContourPlot[x^2 + (y - a)^2 == 9, {x, -14, 14}, {y, -14, 14}, 
       Axes -> True, 
       PlotLabel -> Row[{"$PerformanceGoal ->", $PerformanceGoal}]],
    {a, -3, 3, 1}], 
  Manipulate[ContourPlot[x^2 + (y - a)^2 == 9, {x, -14, 14}, {y, -14, 14}, 
       Axes -> True, PerformanceGoal -> "Quality",
       PlotLabel ->  Row[{"$PerformanceGoal ->", $PerformanceGoal}]], 
   {a, -3, 3, 1}]}]
enter image description here

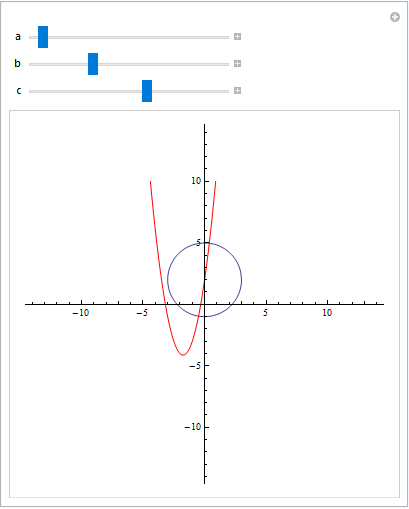
"... draw $ax2+bx+c=0$ in the same plane"

Manipulate[Show[ContourPlot[x^2 + (y - a)^2 == 9, {x, -14, 14}, {y, -14, 14}, 
   Frame -> False, PerformanceGoal -> "Quality"], 
  Plot[a x^2 + b x + c, {x, -10, 10}, PlotStyle -> Red, 
   PlotRange -> 10], Axes -> True], 
  {a, 1, 20, 1}, {b, 1, 20, 1}, {c, -10, 10, 1}]
enter image description here

$\endgroup$
3
  • $\begingroup$ Thank u for your excellent answer. How can add number in the axes there? Manipulate[Plot[a x^2 + b x + c, {x, -10, 10}, PlotRange -> 10], {a, 1, 20, 1},{b, 1, 20, 1}, {c, -10, 10, 1}] Just like the axes in the code I give above. $\endgroup$
    – kile
    Commented May 27, 2019 at 12:04
  • $\begingroup$ @kile, add the option Frame -> False to ContourPlot[...] $\endgroup$
    – kglr
    Commented May 27, 2019 at 12:45
  • $\begingroup$ Thanks man! You help me a lot! Did u major in Math? $\endgroup$
    – kile
    Commented May 27, 2019 at 12:58

Your Answer

By clicking “Post Your Answer”, you agree to our terms of service and acknowledge you have read our privacy policy.

Not the answer you're looking for? Browse other questions tagged or ask your own question.