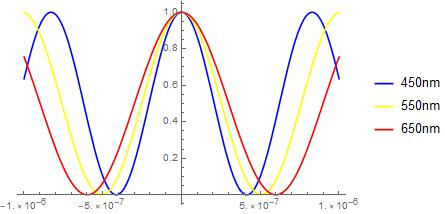
This was harder than it should have been. But I learned some stuff along the way.
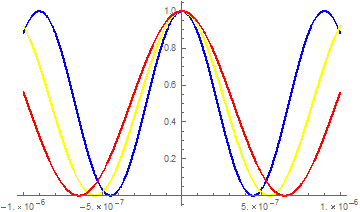
Let's first set up the functions:
f[l_, y_] = 1/2 + Cos[ Pi y/(l 10^-9)]/2;
Plot[{f[450, y], f[550, y], f[650, y]}, {y, -1 10^-6, 1 10^-6},
  PlotStyle -> {Blue, Yellow, Red}]
Now let's make the mixture.
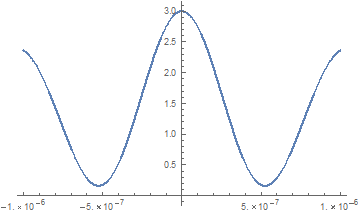
mix[y_] = f[450, y] + f[550, y] + f[650, y];
Plot[mix[y], {y, -1 10^-6, 1 10^-6}]
Now we will plot it using the appropriate color function, turning off ColorFunctionScaling.
Plot[mix[y], {y, -1 10^-6, 1 10^-6}, PlotStyle -> Thickness[0.02],
  ColorFunction -> (Blend[{Blue, Yellow, Red}, {f[450, #1], f[550, #1],
   f[650, #1]}] &), ColorFunctionScaling -> False]
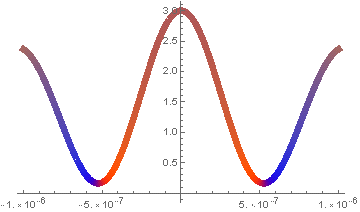
Or perhaps when all three are low, you might want it to be closer to black (indicating that there isn't as much intensity), in which case:
Plot[mix[y], {y, -1 10^-6, 1 10^-6}, PlotStyle -> Thickness[0.02],
  ColorFunction -> (Blend[{Blue, Yellow, Red, Black}, {f[450, #1],
    f[550, #1], f[650, #1], 3 - mix[#1]}] &), ColorFunctionScaling -> False]
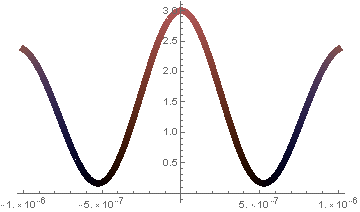
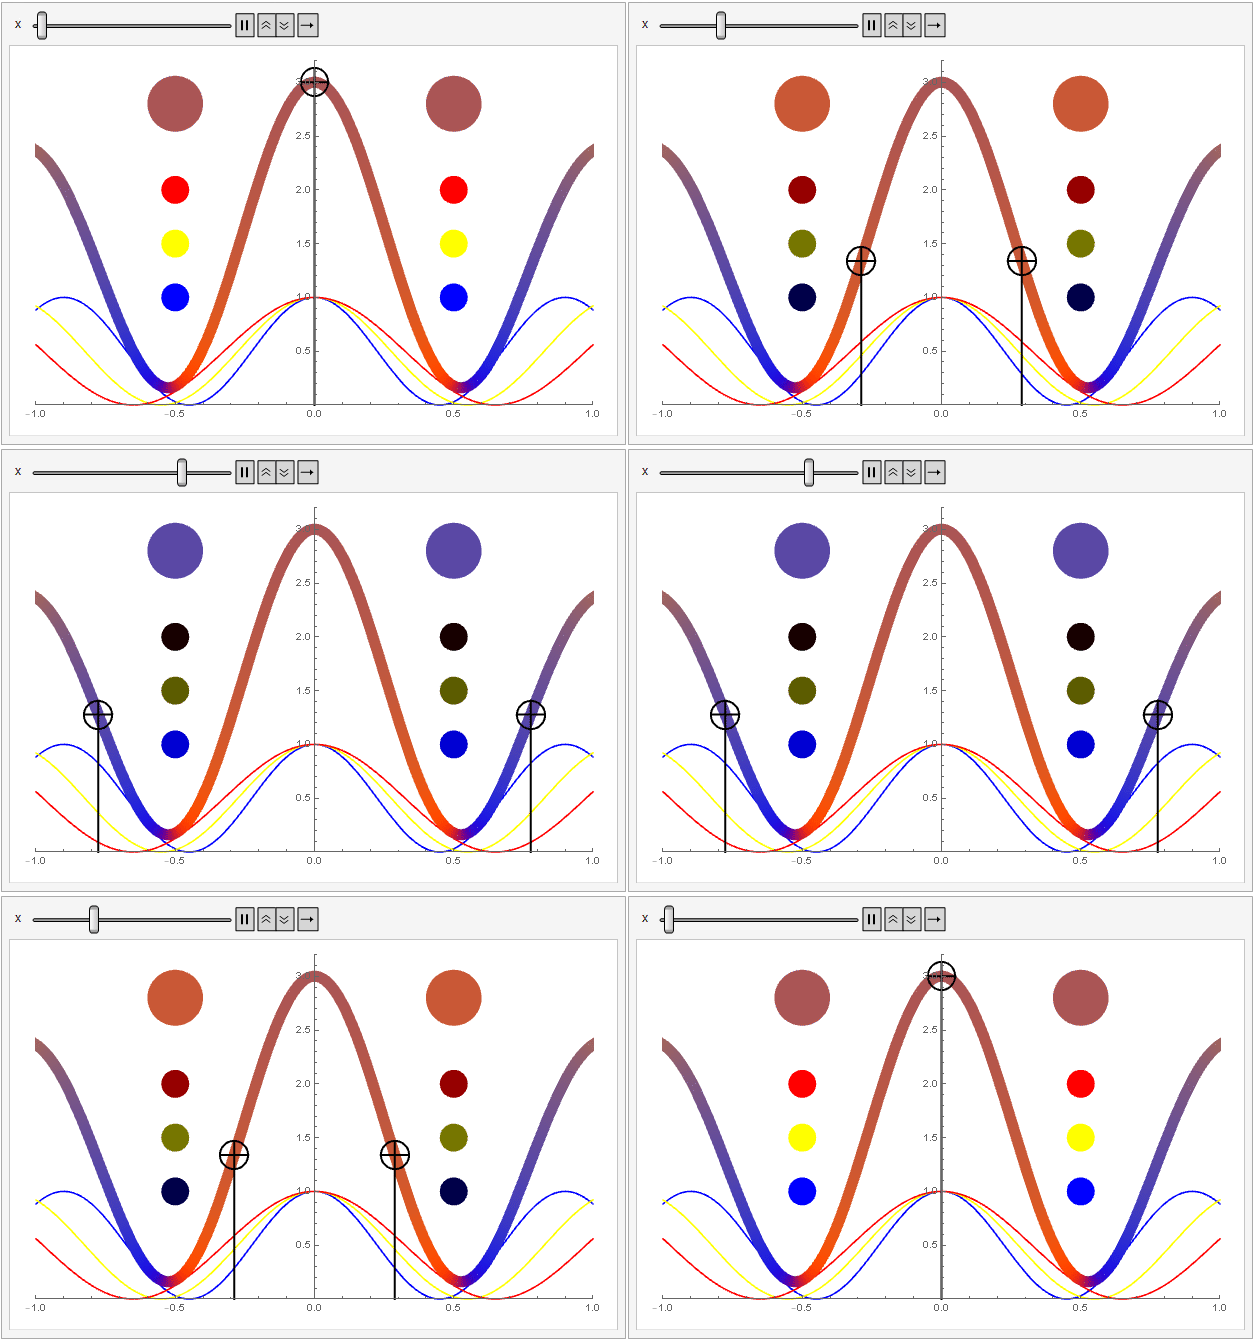
In debugging some of this, I set up a manipulate (shown below as an animate) to explore the mixing. It is kind of instructive.
Animate[Show[
  Plot[{f[450, y 10^-6], f[550, y 10^-6], f[650, y 10^-6]},
    {y, -1 , 1}, PlotStyle -> {Blue, Yellow, Red},
    PlotRange -> {{-1, 1}, {0, 3.2}}, ImageSize -> Large],
  Plot[mix[y 10^-6], {y, -1, 1}, PlotStyle -> Thickness[0.02],
    ColorFunction -> (Blend[{Blue, Yellow, Red,
    Black}, {f[450, #1 10^-6], f[550, #1 10^-6], f[650, #1 10^-6],
    3 - mix[#1 10^-6]}] &), ColorFunctionScaling -> False],
  Graphics[{Black, Thick, Circle[{-x , mix[-x 10^-6]}, {rx, ry}],
    Circle[{x , mix[x 10^-6]}, {rx, ry}],
    Line[{{-x - rx, mix[-x 10^-6]}, {-x + rx, mix[-x 10^-6]}}],
    Line[{{-x, 0}, {-x , mix[-x 10^-6] + ry}}],
    Line[{{x - rx, mix[x 10^-6]}, {x + rx, mix[x 10^-6]}}],
    Line[{{x, 0}, {x , mix[x 10^-6] + ry}}],
    Blend[{Blue, Yellow, Red, Black}, {f[450, -x 10^-6],
      f[550, -x 10^-6], f[650, -x 10^-6], 3 - mix[x 10^-6]}],
    Disk[{-0.5, 2.8}, {2 rx, 2 ry}], ,
    Blend[{Blue, Yellow, Red, Black}, {f[450, x 10^-6],
      f[550, x 10^-6], f[650, x 10^-6], 3 - mix[x 10^-6]}],
    Disk[{0.5, 2.8}, {2 rx, 2 ry}],
    Blend[{Black, Blue}, f[450, -x 10^-6]],
    Disk[{-0.5, 1}, {rx, ry}],
    Blend[{Black, Blue}, f[450, x 10^-6]],
    Disk[{0.5, 1}, {rx, ry}],
    Blend[{Black, Yellow}, f[550, -x 10^-6]],
    Disk[{-0.5, 1.5}, {rx, ry}],
    Blend[{Black, Yellow}, f[550, x 10^-6]],
    Disk[{0.5, 1.5}, {rx, ry}],
    Blend[{Black, Red}, f[650, -x 10^-6]],
    Disk[{-0.5, 2}, {rx, ry}],
    Blend[{Black, Red}, f[650, x 10^-6]],
    Disk[{0.5, 2}, {rx, ry}]}]], {x, 0, 1}]
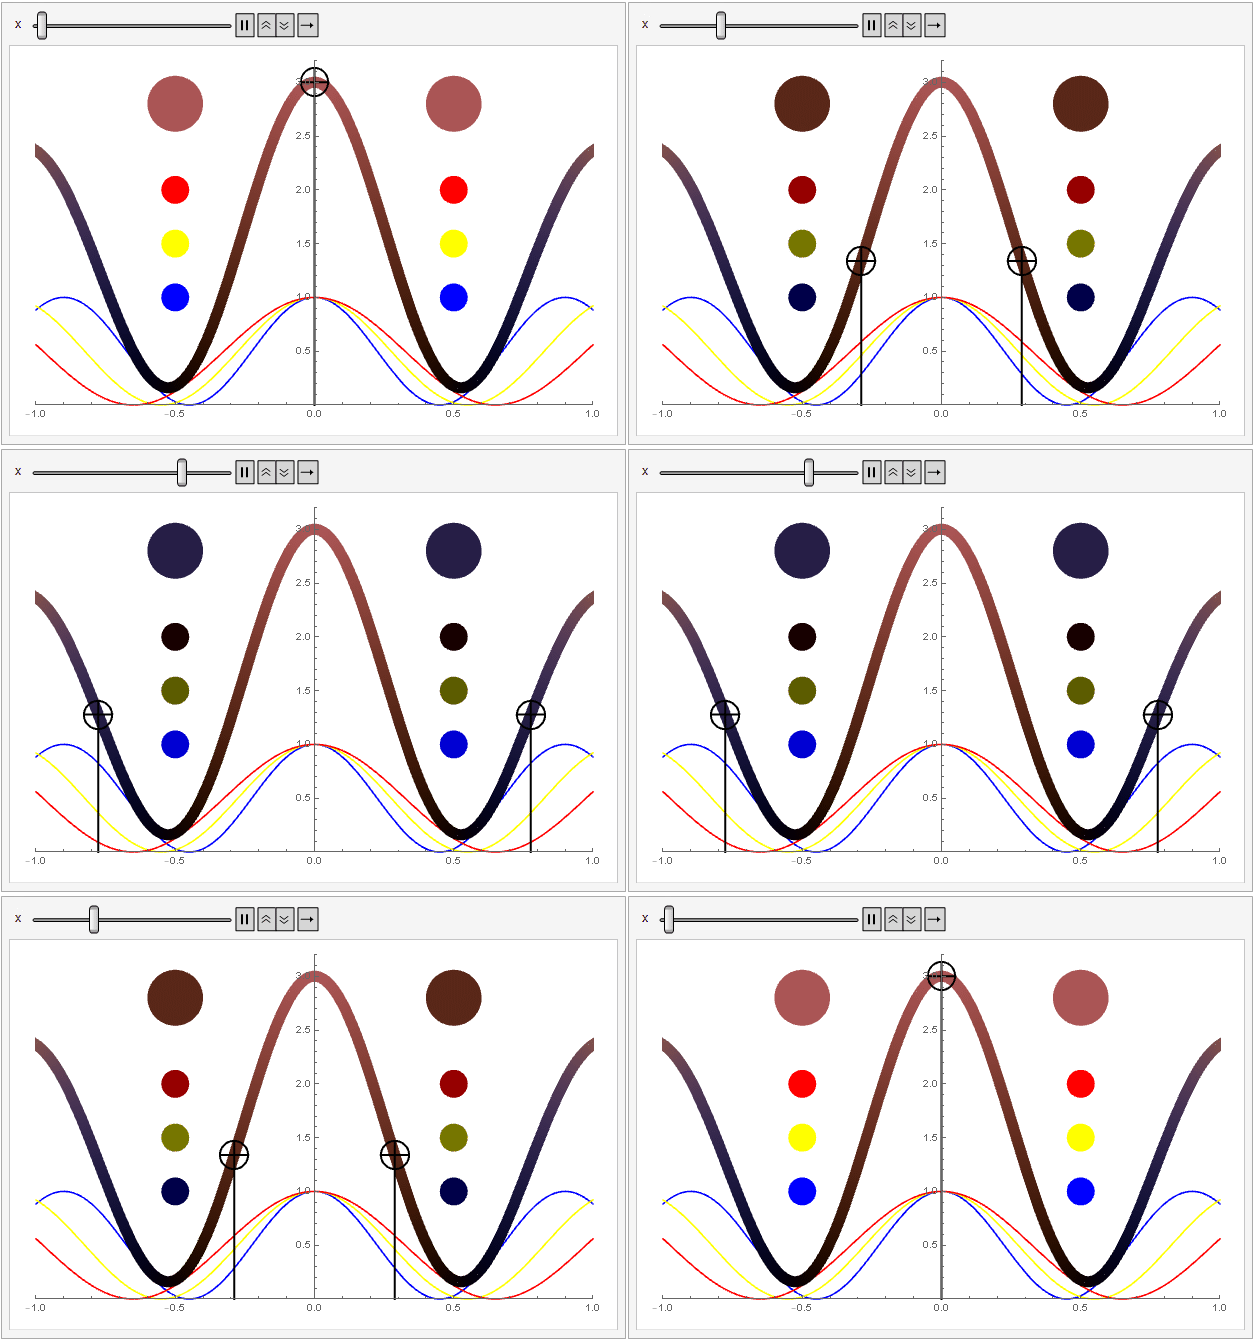
Or the version without Black (code modifications for this left as an exercise to the reader, unless requested):
