4
$\begingroup$

I ploted 3D the function Sin[A/2]Sin[B/2]Sin[C/2] with A, B, C > 0 and A + B + C = Pi.

A basic approach in the post How to plot ternary density plots answers with the use of FindGeometricTransform. How can I transform the Plot3Ded function inside the equilateral triangle with FindGeometricTransform? If there is a simpler method, I would like to know it.


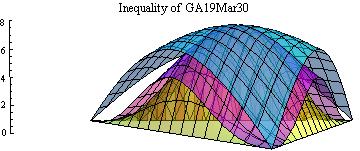
An example of ternary 3D plot of a geometric inequality

Let ABC be a triangle and its radius of circumcircle R = 1.

In ternary 3D plot, based on A, B, C > 0 and A + B + C = Pi, the value of a function is plotted 3-dimensionally on the equilateral domain.

Denote:

a, b, c = the sidelengths of ABC respectively.

s = (a + b + c)/2.

r = the radii of incenter.

ha, hb, hc = the altitudes of ABC respectively.

The bottom (yellow), middle (magenta) and top (cyan) surfaces show the values of left-hand-side, middle and right-hand-side functions of the following inequality by Mr. George Apostolopouls.

Ga19Mar30: 6rs/R ≤ Sin[A](hb + hc) + Sin[B](hc + ha) + Sin[C](ha + ha) ≤ 3s. enter image description here
$\endgroup$
3
  • $\begingroup$ I can make ternary density plots and ternary contour plots according to the post above. But I would like to draw 3D plots with one of the point in the equilateral triangle as the coordinates. The coordinates are essentially 2 dimensional with A + B + C = Pi $\endgroup$ Commented Apr 20, 2019 at 8:01
  • $\begingroup$ If you want to clarify the question further, you can click the edit button in the left-bottom corner of your question . $\endgroup$
    – xzczd
    Commented Apr 20, 2019 at 8:19
  • $\begingroup$ Welcome to Mathematica.SE, seiichikiri! I suggest the following: 1) As you receive help, try to give it too, by answering questions in your area of expertise. 2) Take the tour and check the faqs! 3) When you see good questions and answers, vote them up by clicking the gray triangles, because the credibility of the system is based on the reputation gained by users sharing their knowledge. Also, please remember to accept the answer, if any, that solves your problem, by clicking the checkmark sign! $\endgroup$
    – Chris K
    Commented Apr 21, 2019 at 14:08

3 Answers 3

5
$\begingroup$

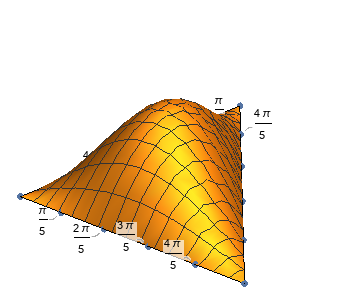
It's not hard to transform the Graphics3D generated by Plot3D if you understand its structure. We already have numbers of posts about this issue so I'd like not to talk about it in this answer, you may check e.g. this post for more info. Here comes the code, notice I've made use of the new-in-v12 feature of Callout to create ticks, which is more troublesome compared to the transforming part in my opinion:

old = Pi First@Triangle[]    
begin = {##, 0} & @@@ (π AnglePath[{0, 120 °, 120 °}])
direction = Normalize /@ Differences@begin;
p3 = Plot3D[Sin[a/2] Sin[b/2] Sin[(Pi - a - b)/2], {a, b} ∈ Triangle@old];

{error, tr} = FindGeometricTransform[Most /@ Most@begin, old];

newp3 = p3 /. 
   GraphicsComplex[pts_, rest__] :>GraphicsComplex[SubsetMap[tr, #, {1, 2}] & /@ pts, rest];

ticks = ListPointPlot3D@Flatten@With[{n = 5}, 
           Table[Callout[begin[[i]] + direction[[i]] j Pi/n, j Pi/n], {i, 3}, {j, 0, n}]];

Show[newp3, ticks, Axes -> False, Boxed -> False, PlotRange -> All]

enter image description here

Hmm… the result doesn't look that great on Wolfram cloud, perhaps it'll be better on Mathematica Desktop?

$\endgroup$
4
  • $\begingroup$ My intension is to compare LHS and RHS of the inequalities. In this case, 6r/R = 24 Sin[A/2]Sin[B/2]Sin[C/2] <= CyclicSum (Sin[A]+Sin[B])/Cot[C/2], where r is the incenter and circumcenter of a triangle. I deleted 3rd line and 7th line. I replaced 6th line by newp3 = p3/. GraphicsComplex[pts_,rest_] -> GraphicsComplex[Map[tr, #,{1,2}]&/@pts,rest]. Is this change allowable? My version of Mathematica 8 does not include SubsetMap. I could plot similar figures as yours. But the base of the plot is isosceles, not equilateral. I found this by rotation. $\endgroup$ Commented Apr 21, 2019 at 3:01
  • $\begingroup$ @seiichikiri No, your usage of Map[...] is incorrect. It should be e.g. newp3 = p3 /. GraphicsComplex[pts_, rest__] :> GraphicsComplex[Join[tr[{#, #2}], {#3}] & @@@ pts, rest]. The shape of triangle looks incorrect because I've added PlotRange -> All and the default BoxRatios is {1, 1, 0.4} in this case. $\endgroup$
    – xzczd
    Commented Apr 21, 2019 at 13:29
  • $\begingroup$ @xzcxd I obtained what I wanted. Thank you very much! $\endgroup$ Commented Apr 22, 2019 at 0:25
  • $\begingroup$ @seiichikiri Glad it help. If my answer resolves your problem, you can accept it by clicking the checkmark sign. $\endgroup$
    – xzczd
    Commented Apr 22, 2019 at 5:08
5
$\begingroup$

Without using any transformations, you have

$$ A = \frac13 - x - \frac{y}{\sqrt{3}}\\ B = \frac13 + x - \frac{y}{\sqrt{3}}\\ C = \frac13 + \frac{2 y}{\sqrt{3}} $$

In this form, they span the ranges $[0,1]$ over an equilateral triangle with unit edges, and satisfy $A+B+C=1$. In what follows I'll use $a$, $b$, $c$ instead of the capital letters because it's not a good idea to use capital letters for your own definitions in Mathematica.

Plotting your function, you need to multiply these with $\pi$ to get your desired range.

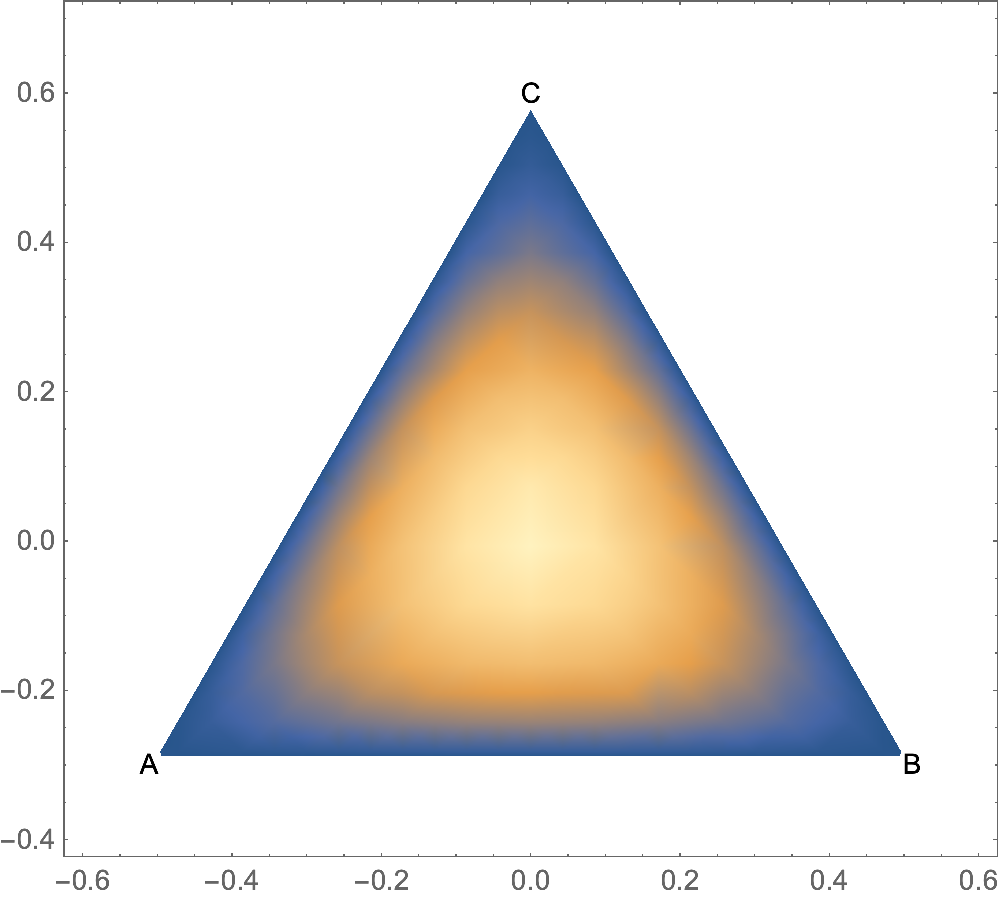
Here's a very simplistic way of plotting that does not generate any tick marks. It is mostly for getting a quick overview. If you want proper tick marks you need to follow some of the other recommendations, for example on question 39733. Also, MeshFunctions can give interesting meshes when combined with the effective coordinates $a$, $b$, $c$.

f[a_, b_, c_] = Sin[π*a/2] Sin[π*b/2] Sin[π*c/2];
DensityPlot[f[1/3-x-y/Sqrt[3], 1/3+x-y/Sqrt[3], 1/3+2y/Sqrt[3]],
  {x, -0.6, 0.6}, {y, -0.4, 0.7}, 
  RegionFunction -> Function[{x, y}, 0<=1/3-x-y/Sqrt[3]<=1 && 0<=1/3+x-y/Sqrt[3]<=1 && 0<=1/3+2y/Sqrt[3]<=1],
  AspectRatio -> Automatic, 
  Epilog -> {Text["A", {-1/2, -1/(2 Sqrt[3])}, {Sqrt[3]/2, 1/2}], 
             Text["B", {1/2, -1/(2 Sqrt[3])}, {-Sqrt[3]/2, 1/2}], 
             Text["C", {0, 1/Sqrt[3]}, {0, -1}]}]

enter image description here

Here is what happens if we set the function $f(a,b,c)$ to either $a$, $b$, or $c$: you can see the behavior of these coordinates,

enter image description here

$\endgroup$
2
$\begingroup$
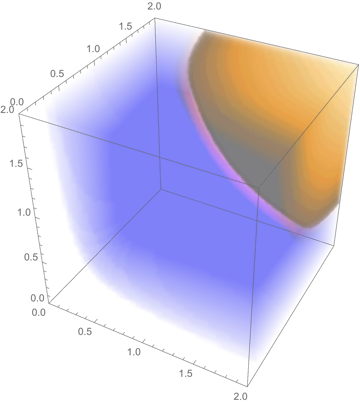
DensityPlot3D[Sin[a/2] Sin[b/2] Sin[c/2],
 {a, 0, 2}, {b, 0, 2}, {c, 0, 2}]

enter image description here

$\endgroup$

Your Answer

By clicking “Post Your Answer”, you agree to our terms of service and acknowledge you have read our privacy policy.

Not the answer you're looking for? Browse other questions tagged or ask your own question.