5
$\begingroup$

I'm ploting the phase space of a pendulum problem using a symplectic Euler scheme.

$\qquad H = \frac{1}{2}p^2 - \cos q$, where $\dot{p}=-\sin q$ and $\dot{q}=p$

h=0.2; (*time step*)
p[0]=0.0; (*initial conditions*)
q[0]=0.5;

p[i_] := p[i] = p[i - 1] - h*Sin[q[i - 1]];
q[i_] := q[i] = q[i - 1] + h*p[i - 1] - h^2*Sin[q[i - 1]];

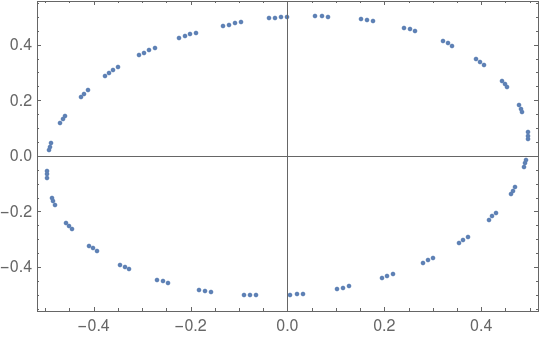
ListPlot[Table[{p[i], q[i]}, {i, 0, 100}], Frame -> True]

gives

phase space plot

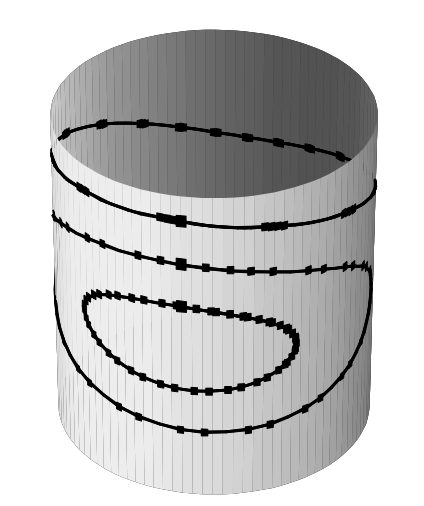
Since the vector field is $2π$-periodic in q, it is natural to consider q as a variable on the circle $S^1$, I'd expect it to look something like

enter image description here

Any suggest how to do it?

$\endgroup$
2
  • $\begingroup$ There is no such thing as a "curved plane". If want to plot on a 2-manifold, please give a description of the manifold in Wolfram Language code. $\endgroup$
    – m_goldberg
    Commented Apr 6, 2019 at 5:52
  • $\begingroup$ @MichaelE2 it is indeed a duplicate, I'm happy with the solution provided, feel free to close it. $\endgroup$
    – Gvxfjørt
    Commented Apr 8, 2019 at 1:46

1 Answer 1

7
$\begingroup$

h = 0.2; p[0, a_] := 0; q[0, a_] := a p[i_, a_] := p[i, a] = p[i - 1, a] - h*Sin[q[i - 1, a]]; q[i_, a_] := q[i, a] = q[i - 1, a] + h*p[i - 1, a] - h^2*Sin[q[i - 1, a]];

plots = Table[ ListPointPlot3D[ Table[{Sin[q[i, a]], Cos[q[i, a]], p[i, a]}, {i, 0, 100}], PlotStyle -> PointSize[0.008], PlotRange -> {{-1, 1}, {-1, 1}, {-3, 3}}], {a, 0.5, 3, 0.5}];

Show[plots, Graphics3D[{Opacity[0.1], Cylinder[{{0, 0, -3}, {0, 0, 3}}]}]]

enter image description here

$\endgroup$

Not the answer you're looking for? Browse other questions tagged or ask your own question.