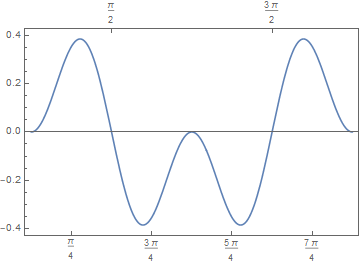
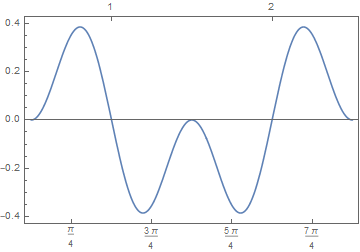
This example was already previously investigated in this website (A 2D-plot with second X-axis) but I want to know little bit more about that. The code is as follows. Plot has two $x$ axis. In the upper $x$ axis, how can I display the point $\frac{\pi}{2}$ as 1 and $\frac{3 \pi}{2}$ as 2. But it should not reflect on other axis. I just want to display the points mentioned at upper $x$- axis with different numbers.
npi2 = {π/2, 3 π/2};
npi3 = {π/3, 2 π/3, 4 π/3, 5 π/3};
npi4 = {π/4, 3 π/4, 5 π/4, 7 π/4};
Plot[Sin[x]^2 Cos[x], {x, 0, 2 π}, Frame -> True,
 FrameTicks -> {{Automatic, npi3}, {npi4, npi2}}]


